
NATGAS regained some ground yesterday after a dynamic wave of declines that saw nine straight sessions of declines. From a technical point of view, gas broke out below the key support zones marked by the 50-, 100- and 200-day exponential moving averages (on the chart these are the blue, purple and gold curves, respectively). The RSI indicator shows that US natural gas is now trading at its lowest levels since February of this year.
From a fundamental point of view, the temperature forecasts for the U.S. point to an all-time high. The 2-yr forecasts at this point settle in the region of 0.5 standard deviations of the ECMWF forecast range.
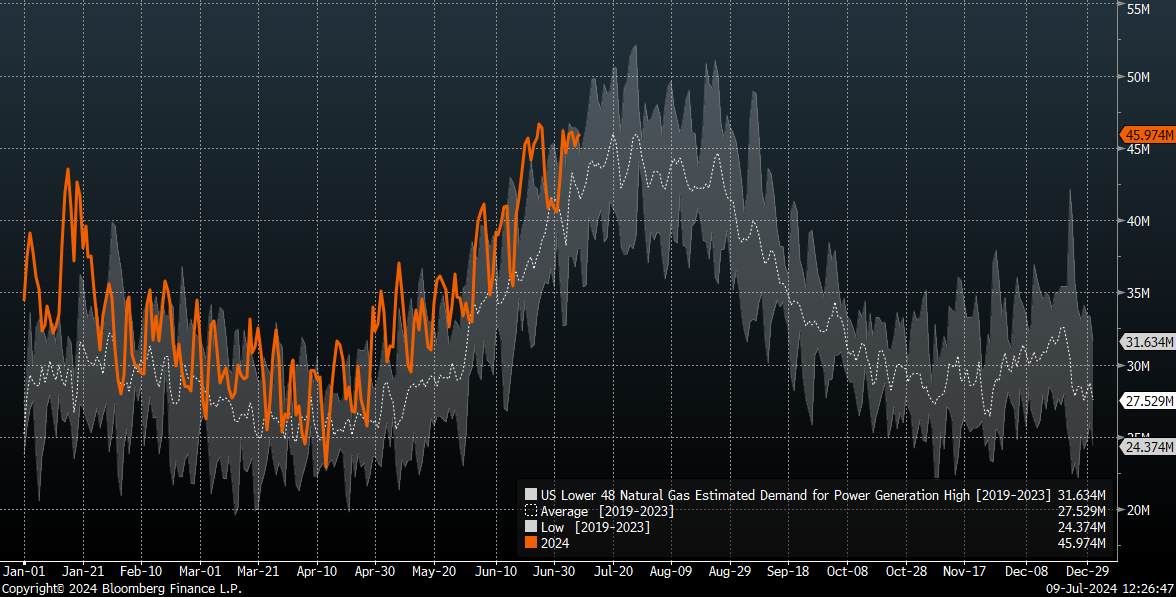
Projected gas demand for electricity generation is now coming out above the upper range of the 5-year average. Source: Bloomberg Financial LP
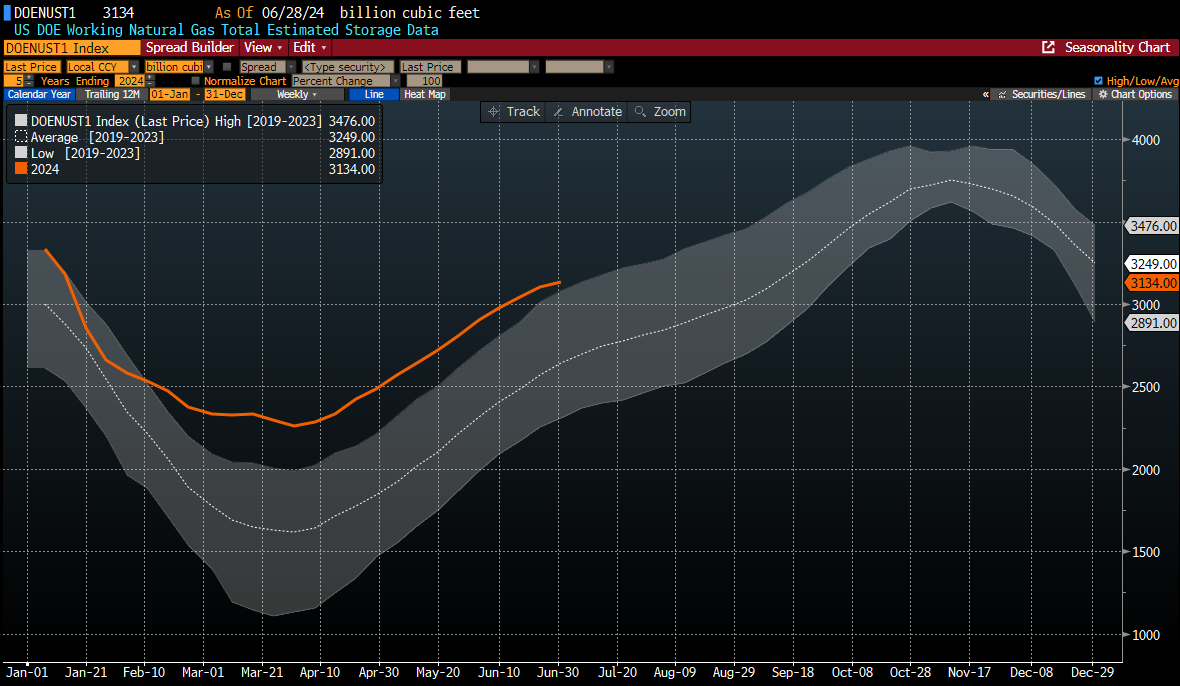
Downward pressure on gas, however, continues to be exacerbated by US gas inventories remaining high on a seasonal basis. Source: Bloomberg Financial LP
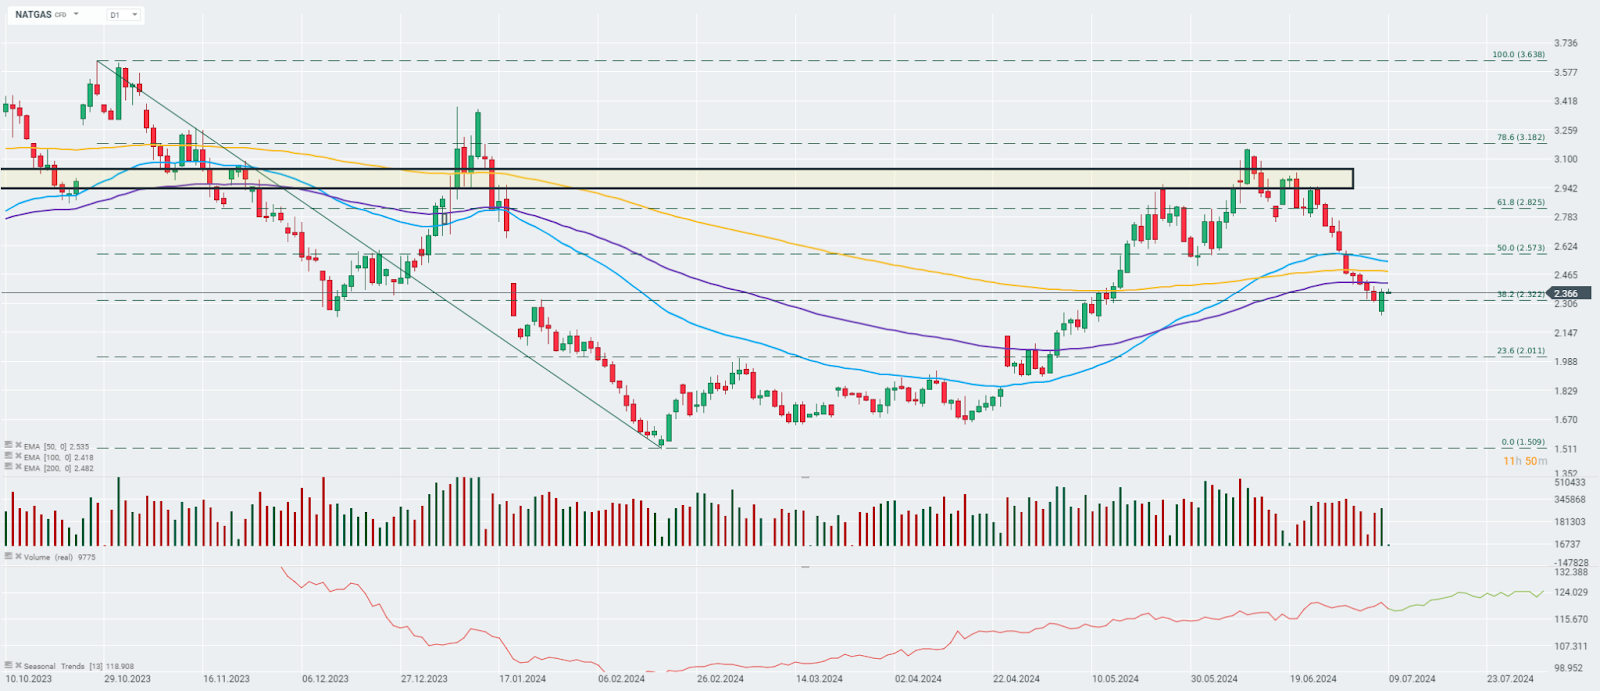
From a technical point of view, the key question now seems to be whether NATGAS will manage to return above the range of the 100-day EMA (purple curve), which could be an important resistance point on the chart in the short term. The most important support remains the daily minimum from yesterday's session. Source: xStation

ملخص اليوم: تباين في أداء الأسهم مع تخلف قطاع التكنولوجيا، وارتفاع في أداء الأسواق الأوروبية مدعوماً بنتائج الأرباح ومؤشرات مديري المشتريات. (24.07.2026)

ثلاثة أسواق تستحق المتابعة الأسبوع المقبل (24.07.2026)

انخفاضات في النفط قبل عطلة نهاية الأسبوع!

متى سيصلنا ارتفاع أسعار النفط؟