
Cryptocurrencies are doing quite well today, we see an influx of positive sentiment despite the negative sentiment on the indices:
- Bitcoin and Ethereum have recently gained some momentum disrupting the correlation with the NASDAQ index. Also shining in the green today are the altcoins among which UNISWAP and NEO stand out, rising more than 14%;
- Bitcoin's rise above $20,000 resulted in the liquidation of short positions worth about $45.5 million;
According to some analysts, the catalyst for Bitcoin's price may be the weakening of the dollar index, which pointed to 103 points today against yesterday's outstanding peak above 114 points. On the other hand, however, Fed policy and data from the U.S. economy could still provide fuel for the U.S. currency's rise.
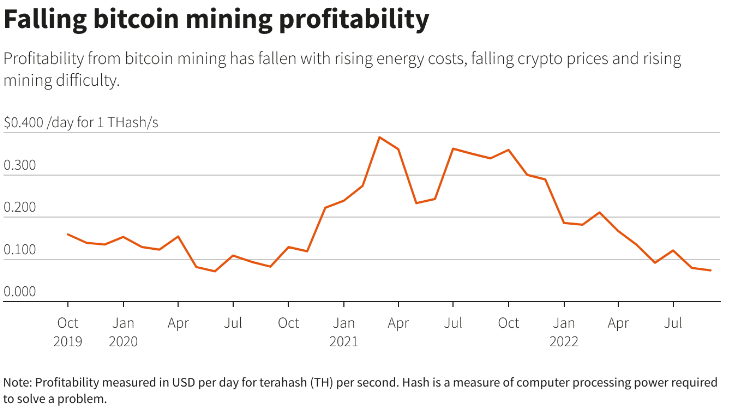
Bitcoin mining is becoming increasingly unprofitable and is currently at spring/summer 2020 levels. The sinking hash rate means profitability is being eroded by and is weighing on Bitcoin miners by making the stocks of Bitcoin 'mining' companies RIOT Blockchain (RIOT.US), HIVE Blockchain (HIVE.US) or Marathon Digital (MARA.US) lose. Additionally, margins are being undermined by record electricity prices, which could become a problem for all Proof of Work projects. Source: bitinfocharts.com, Reuters, Vineed Sachdev, Manas Scharma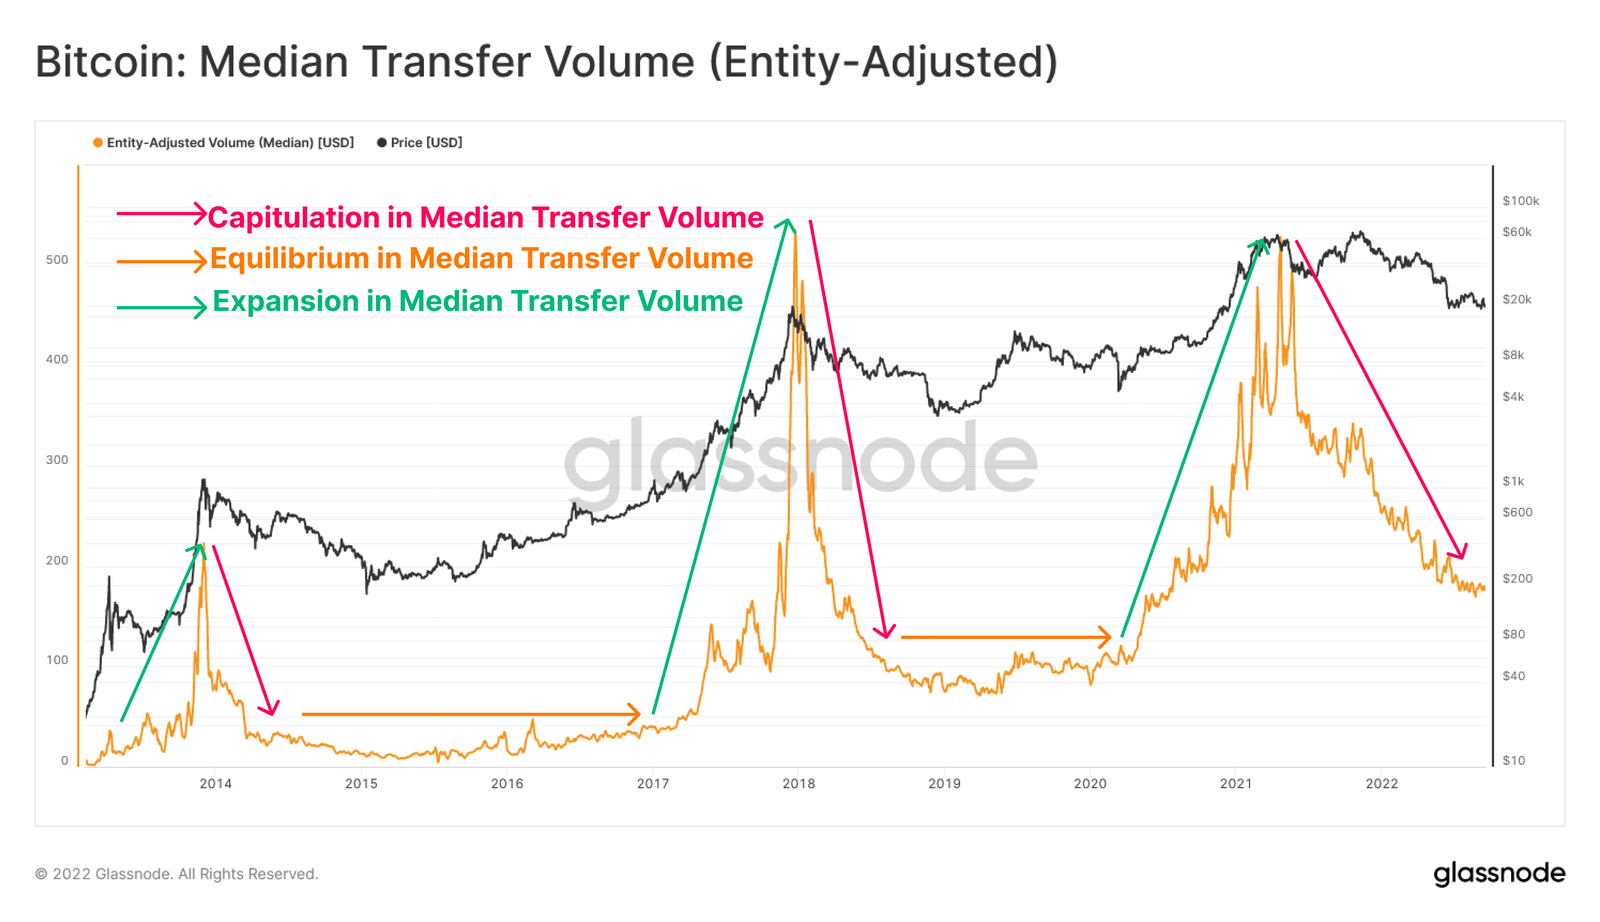 The number of new addresses that have executed a transaction on Bitcoin's blockchain is clearly declining.Currently, about 83,000 new addresses are active per day, which is the low for the entire cycle starting in 2020. On the other hand, the new minimum is still higher than the bottom of the 2018 bull market, when the influx of new unique addresses performing transactions per day settled around 66.5 thousand.Nevertheless, the indicator shows a big slowdown in network activity, although for contrarian investors it can be read as one of the signals of the bottom of the bull market. Source: Glassnode
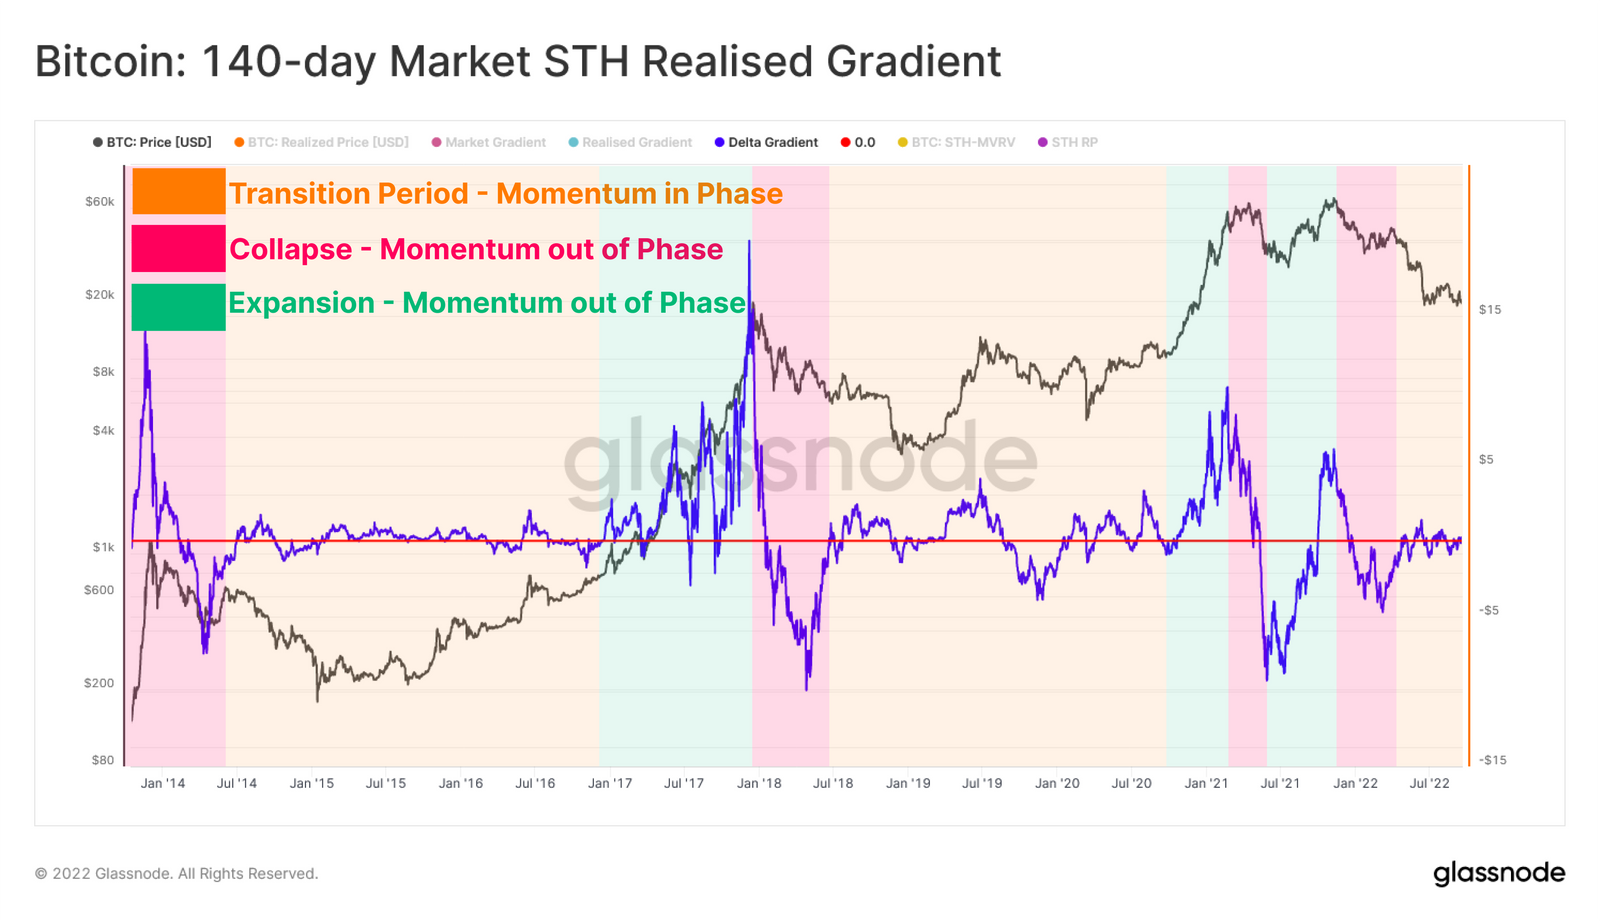 The on-chain data indicates that long-term investors and so-called HODLers, not inclined to sell Bitcoin, are not currently an active group of investors. The lead is led by short-term tz.w STH (Short Term Holders), whose behavior is analyzed in the chart above. In some phases of the market also appears. so-called speculative capital, which resembles a rapid price injection. The above Market Realized Gradient Oscillator, is designed to measure the relative changes between the so-called speculative value (inflated or nailed down, among other things, during periods of low liquidity) and the real activity of STH addresses. The chart divides the period into three phases (green, red, orange). Green indicates upward momentum, when speculative capital exceeds the activity of STH addresses. Red denotes periods of price collapse, STH addresses feel fear and capitulate. Orange indicates a balance between price movements and STH inflows, which usually heralds the exhaustion of selling forces, which in turn often shows the final bottom of the bull market. Looking at the chart, we can see that STH addresses are in equilibrium, which has historically occurred precisely during key phases of a bear market. The problem, however, becomes that the current accumulation and consolidation of short-term address positions in the $18,000 - $20,000 range resembles a fortress that could fall if demand fails to permanently consolidate positions above $20,000. Source: Glassnode
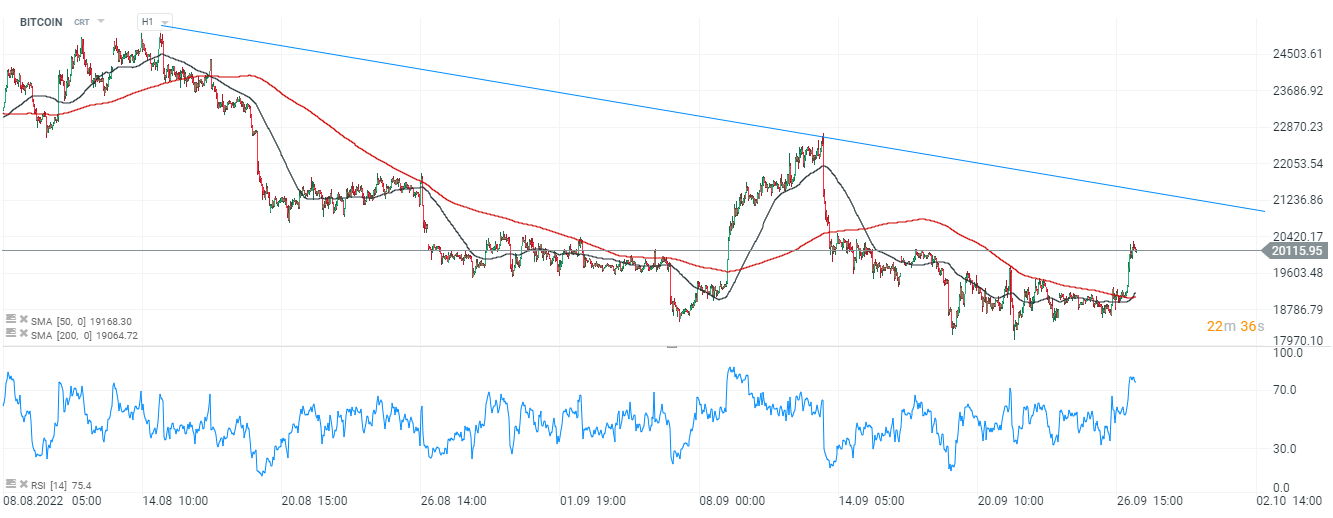 Bitcoin chart, H1 interval. We can see that Bitcoin has risen above the 200-session average on the hourly interval, and the 50-day average has crossed the SMA 200 from below, which may herald a short-term trend change and give strength to the demand side. On the other hand, the RSI above 75 points indicates significant overheating, which in the past usually heralded an impending correction. The price is still moving in line with the downward trend line, which runs around $21,000 making it possible that it is in this zone that the key clash between demand and supply will take place. Source: xStation5

AI หนุนการฟื้นตัว หุ้นเทคฯ กลับมาแข็งแกร่ง

สรุปตลาดประจำวัน: สงครามชิปกดดัน Wall Street ขณะที่น้ำมันร่วงแรง หลังสหรัฐฯ–อิหร่านบรรลุข้อตกลงหยุดยิง ⭐

ข่าวเด่นวันนี้ 24 ก.ค.

Bitcoin พุ่งเหนือ 66,000 ดอลลาร์ หลังเงินทุนไหลเข้า ETF ฟื้นตัว แต่ Glassnode เตือนความผันผวนอาจเพิ่มขึ้น