
Surprise Hamas attack on Israel over the weekend and swift and decisive response of the Israeli Defense Forces has greatly increased the risk of further instabilities in the Middle East, the world's key oil producing region accounting for around a third of global supply. Oil prices launched new week's trading with an over 3% bullish price gap and extended those gains to over 5% during the first half of Asian session. However, gains have been steadily erased later as there are no signs of any immediate spillover of the situation into other Middle East regions. Nevertheless, oil traders should watch developments in Gaza Strip and broader region closely as oil prices will be vulnerable to headline risk.
Taking a look at OIL chart at H1 interval, we can see that price tested a key technical resistance after today's higher opening. The $88.30-88.40 area is marked with the upper limit of the local market geometry as well as the 38.2% retracement of a the ongoing correction. A long upper wick of the candlestick (orange circle) shows strong supply side reaction to this area. From a technical point of view, a continuation of a short-term downtrend looks likely.
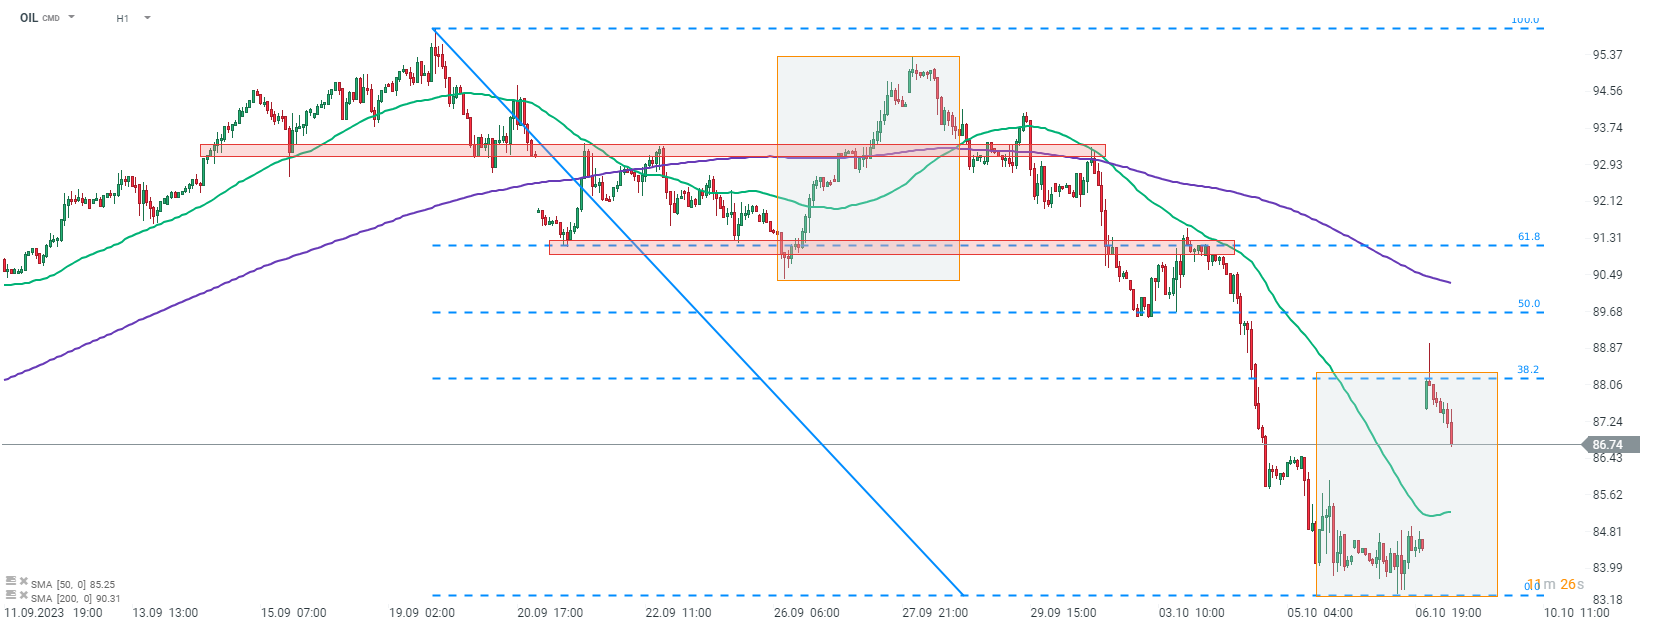 Source: xStation5

SILVER พุ่งทะลุ $59 ดึงดูดเงินทุนกลับมาอีกครั้ง ขณะที่ทองคำยังอยู่ใต้เงาของโลหะน้องใหม่

🛢️ น้ำมันร่วงหลังแตะระดับ $90

Economic Calendar: จับตาเงินเฟ้อเยอรมนี-แคนาดา พร้อมชุดข้อมูลเศรษฐกิจโปแลนด์

Morning Wrap: น้ำมันกลับมายืนเหนือ $90 ขณะที่ AI จากจีนกดดันหุ้นเทคฯ