
Volatility soared last week following the FOMC meeting. Large price swings could be observed on gold, USD and stock markets. Elsewhere, Bitcoin had a volatile start to the week following widening clampdown on crypto mining in China.
GOLD
Gold market has experienced a massive sell-off recently. Looking at the daily time frame, we can see that the precious metal broke below the upward channel and the downward move accelerated. However, buyers managed to halt decline ahead of a key support zone at $1,755, which is marked with previous price reactions. Should the upward correction extend, the nearest resistance to watch can be found at the upper limit of local 1:1 structure at $1,809. This area is also strengthened by the local low from mid-May. On the other hand, breaking below the aforementioned support at $1,755 may pave the way for a bigger downward move.
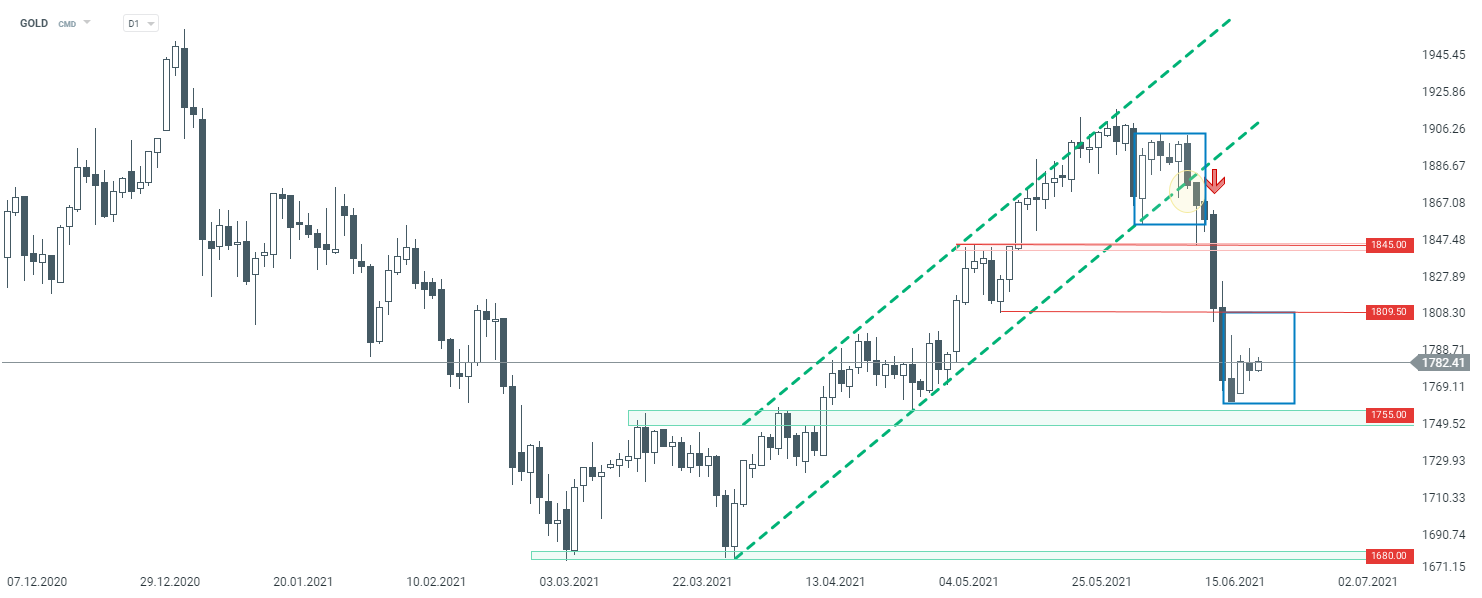 GOLD D1 interval. Source: xStation5
US100
Next, let's take a look at the US tech index - Nasdaq (US100). Looking at the technical situation on the H4 interval, one can see that the index reached a fresh all time high today. However, the upward movement was halted and a local downward correction started. Nevertheless the main trend remains upward and there are a lot of support levels nearby to support it. The nearest key area to watch lies in the vicinity of 14,020 pts, where the lower limit of 1:1 structure, as well as previous price reactions are located. Should sellers manage to break below, the next area to watch is 13,870 pts.
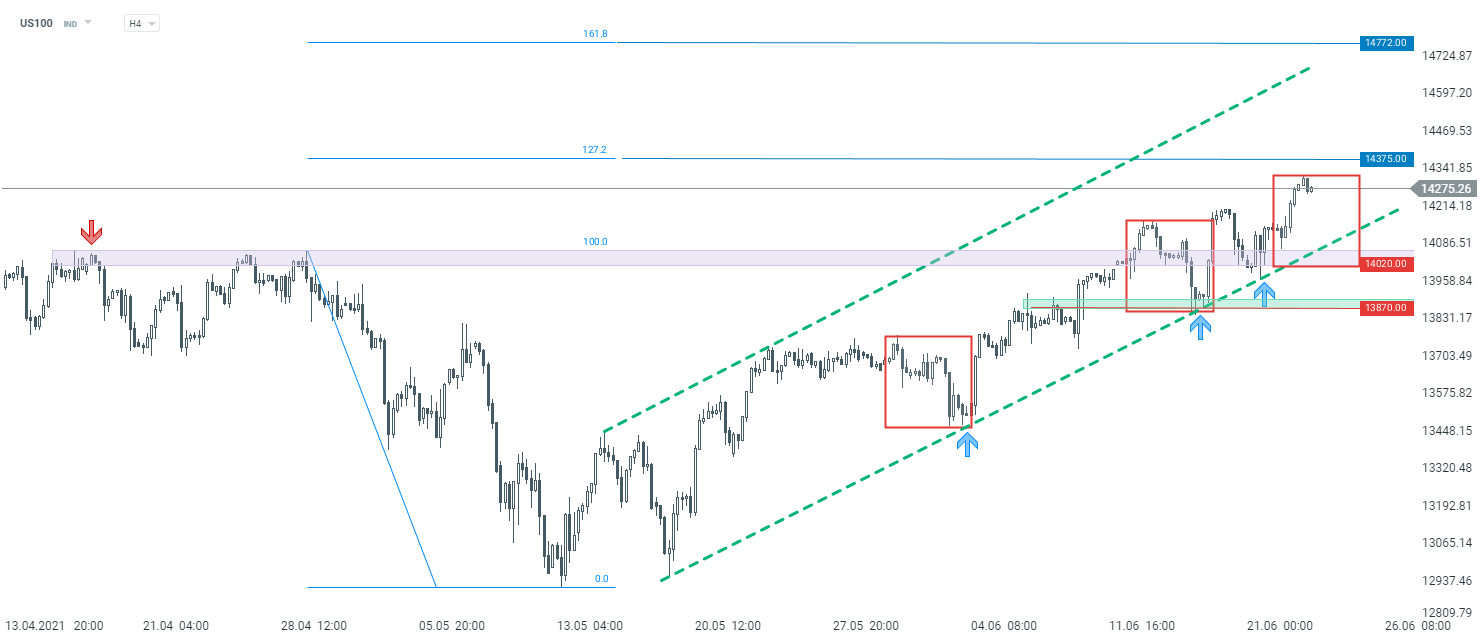 US100 H4 interval. Source: xStation5
BITCOIN
Strong declines on the cryptocurrency market could be observed during yesterday's session. The main cryptocurrency - Bitcoin - fell over 8% but the buyers managed to regain control and the whole downward move was erased. Looking at the daily time frame, we can see that a bullish hammer formation appeared on the chart. Should current upward momentum prevail, one may expect the price to continue to rebound from the latest sell-off. The area near the $40,000 mark may act as a key mid-term resistance.
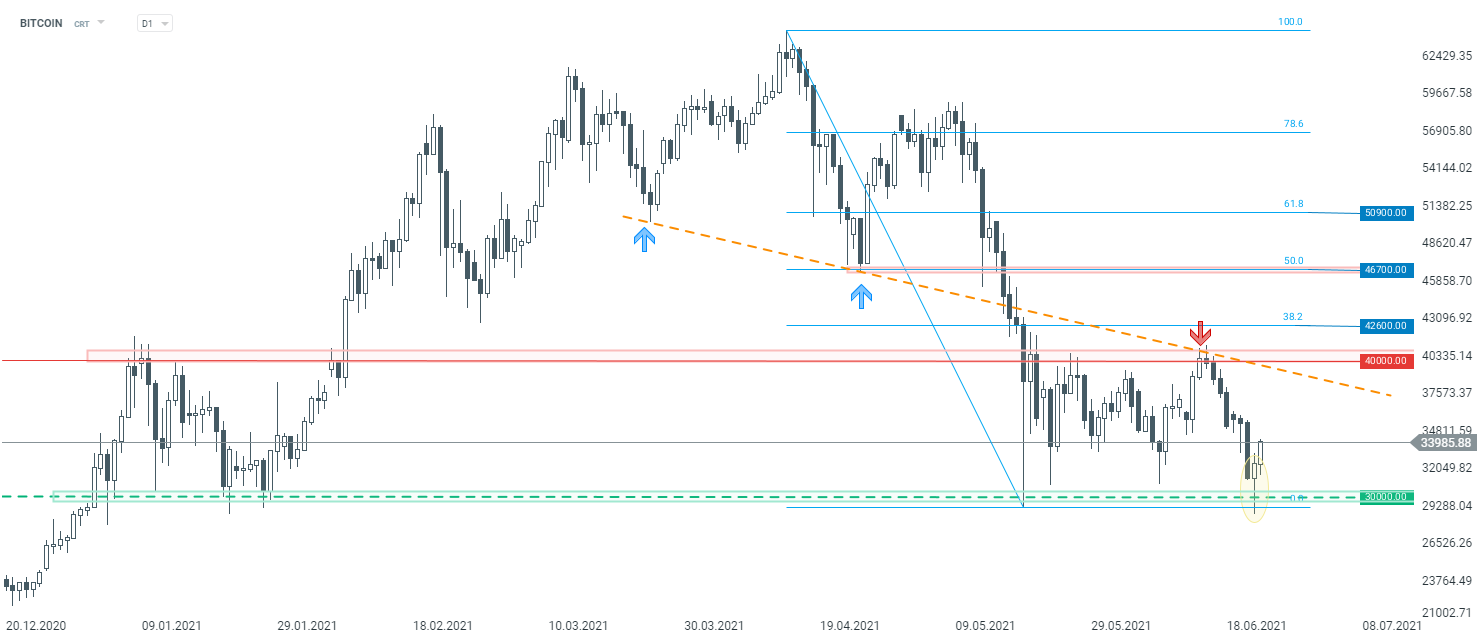 BITCOIN D1 interval. Source: xStation5

SILVER พุ่งทะลุ $59 ดึงดูดเงินทุนกลับมาอีกครั้ง ขณะที่ทองคำยังอยู่ใต้เงาของโลหะน้องใหม่

ตลาดเด่นรายวัน 🔼 Nasdaq พุ่ง 1.2% หลังหุ้นกลุ่มเซมิคอนดักเตอร์ฟื้นตัว

Morning Wrap: ตลาดหุ้นลุ้นรีบาวด์ ท่ามกลางความขัดแย้งสหรัฐฯ-อิหร่าน

🛢️ น้ำมันร่วงหลังแตะระดับ $90