
Looking technically at the NZDUSD chart on the H4 interval, a head and shoulders formation has formed. Currently, the price is testing the neckline of the said formation (purple line on the chart below), and if this line is broken, the discount could take a turn for the worse. According to classical technical analysis assumptions, this will be an excuse to change the trend to a downtrend. The downward scenario is also supported by the Overbalance methodology. Last week, the price rebounded from the upper limit of the 1:1 system (red rectangle), which confirms the bearish sentiment. If such a scenario is successful, the levels of 0.6000, and 0.5900 should be considered as the closest supports, the former stemming from the 61.8% Fibonacci measure of the last upward wave and previous price reactions, and the latter from the Fibo ratio itself.
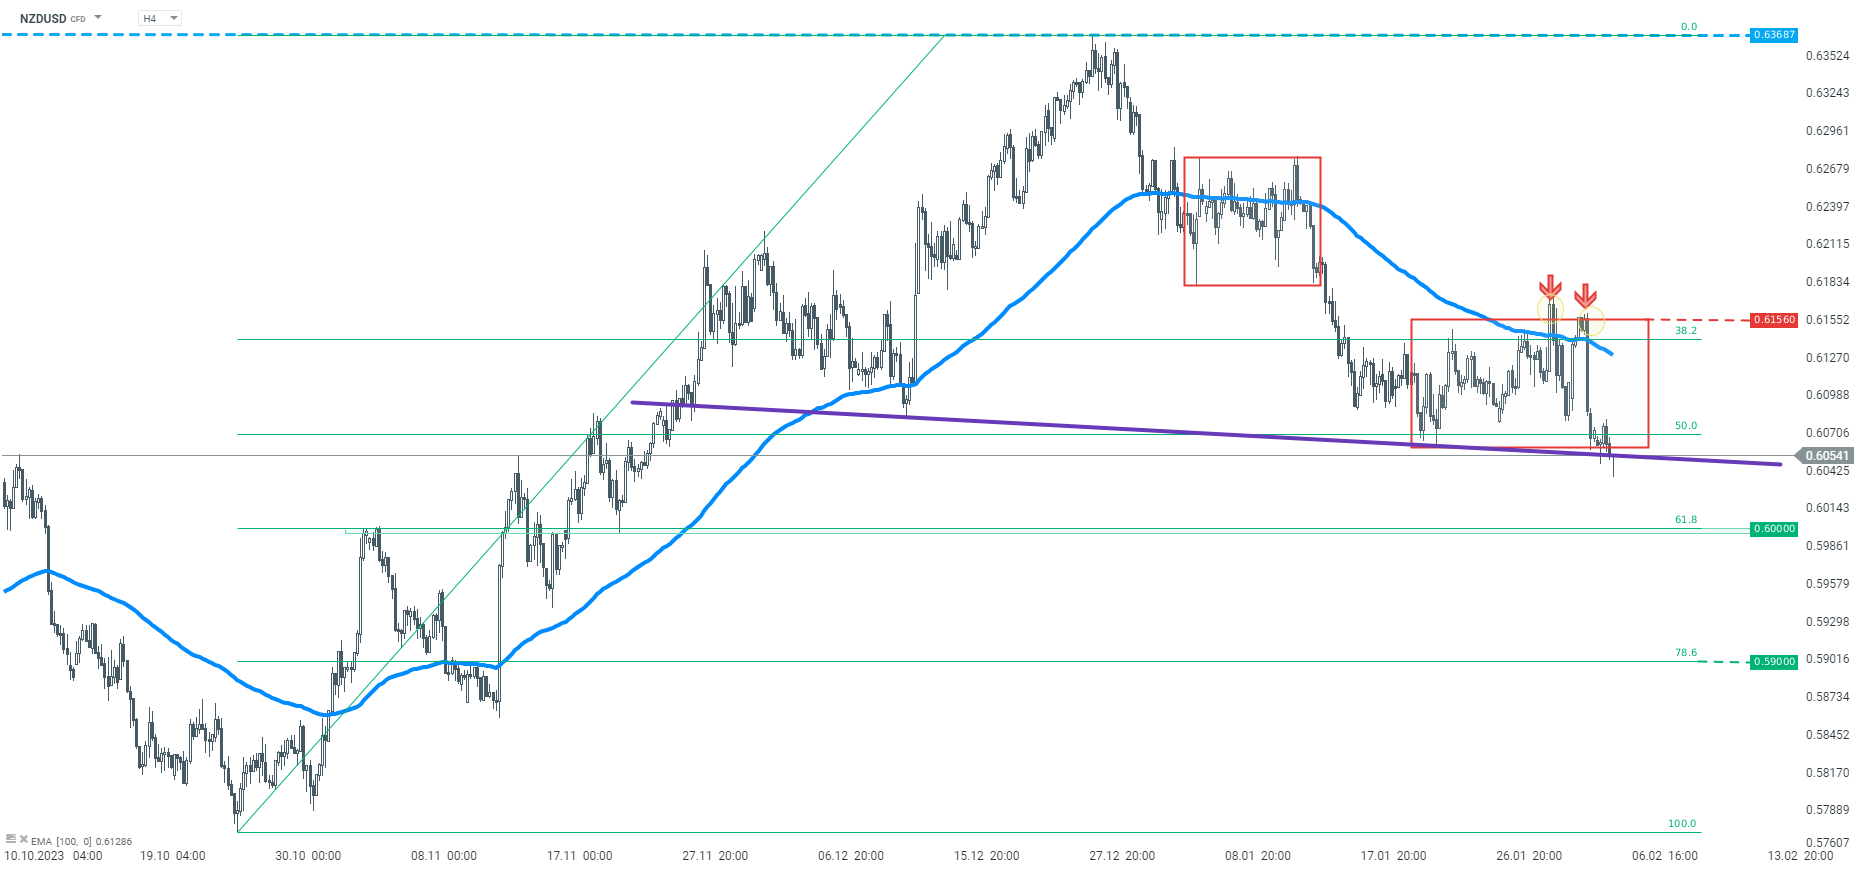 NZDUSD H4 interval. Source: xStation5

انخفاض AUDUSD بعد قرار بنك الاحتياطي الأسترالي رغم استمراره في تبني موقف متشدد ⚔️

عاجل: الإنتاج الصناعي الأمريكي بقراءات متباينة

التقويم الاقتصادي: هل سيجد الين دعماً؟ (15.06.2026)

انكماش الناتج المحلي الإجمالي للمملكة المتحدة وارتفاع الجنيه الإسترليني؟ 💷