



US, data pack for May.
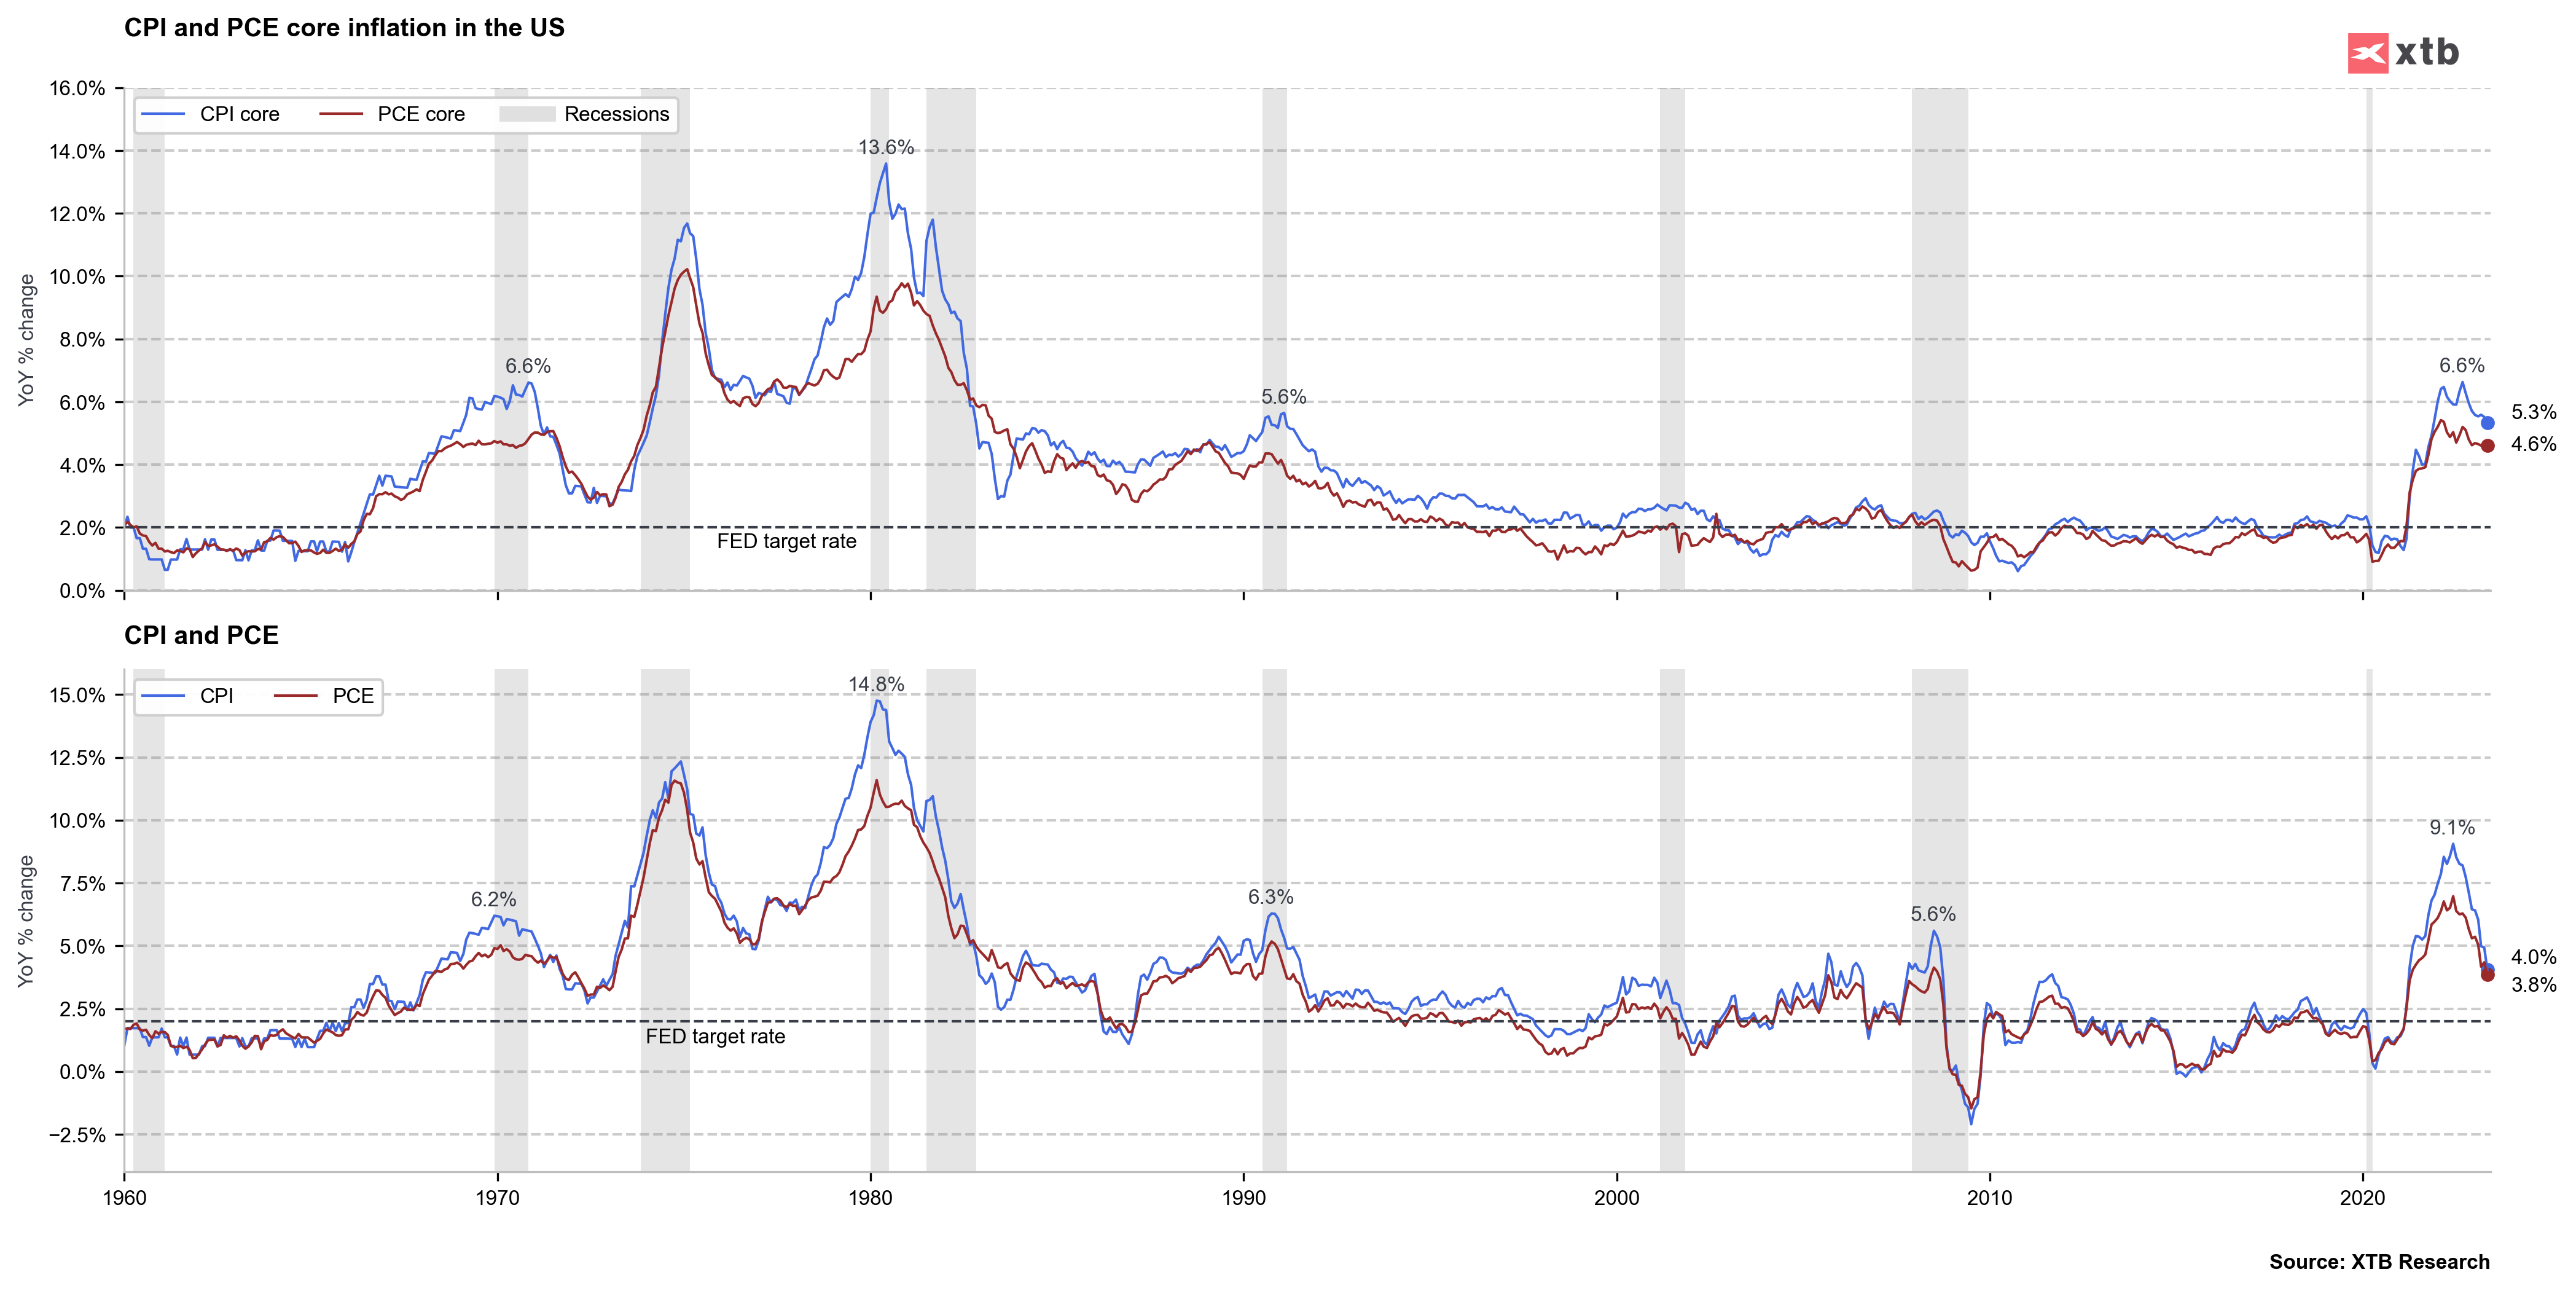
- PCE price index y/y: 3.8% vs 3.8% exp. and 4.4% previously
- PCE price index m/m: 0.1% vs 0,1% exp and 0.4% previously
- Core PCE y/y: 4.6% vs 4.7% exp and 4.7% previously
- Core PCE m/m: 0.3% vs 0.4% exp and 0,4% previously
- Consumer spending data: 0.1% vs 0.3% exp and 0.4% previously
In May, current-dollar personal income increased due to higher compensation, transfer receipts, and income from assets. Spending on services, particularly healthcare, "other" services, and transportation, rose, while spending on goods, including vehicles and energy, decreased. Personal outlays increased, and personal saving reached $910.3 billion.
Prices saw a slight increase, with goods prices decreasing and services prices rising. Compared to the previous year, the PCE price index increased, driven by higher prices for goods and services. Real PCE experienced a small decrease, primarily in spending on goods.
The US dollar depreciates slightly before the PCE publication, with EURUSD rising to 1.087. After the publication, the dollar is weakening further against the EUR.

EURUSD, M15 interval, source xStation 5


วอลล์สตรีทและโลหะมีค่าพยายามฟื้นตัว ขณะที่ราคาน้ำมันพุ่งเกือบ 2%

สต็อกน้ำมันดิบลดลงอย่างมาก 🛢️📉

Economic Calendar: วันพุธค่อนข้างเงียบ จับตารายงานการประชุม FOMC และตลาดน้ำมัน 🛢️


Morning Wrap (07.10.2026)