
USDJPY fell 0.65% to 152.7300 today, recording its biggest monthly decline since November 2022. From peaks above 161.0000, the decline already exceeds 5.60%.
A dynamic change in the trend occurred after the Bank of Japan intervened in the foreign exchange market in the first half of the month, around July 10-12. The sell-off was accelerated by lower CPI data from the US, which led to a sharp devaluation of the dollar.
Higher PPI (wholesale) inflation data came from Japan today. Business services prices rose the most in more than three decades to 3.00% against expectations of 2.60%. If this translates into consumer inflation, it will be another reason for the BoJ to tighten monetary policy further.
The BoJ will hold its next meeting next week. The bank is likely to debate whether to raise interest rates by 0.10% and present a plan to reduce bond purchases. The decision on interest rates will depend on policymakers' conviction that consumption will recover and keep inflation stable around the bank's 2% target.
USDJPY (D1)
The USDJPY chart shows dynamic declines after breaking the long-term upward trend line. The declines halted around the support zone at 150-152 JPY per USD. This zone coincides with the 200-session SMA, providing additional support. Current levels are crucial, and a short-term rebound cannot be ruled out. However, if the selling pressure proves stronger, it is important to closely watch the next support levels, namely 145.000 and 148.000.
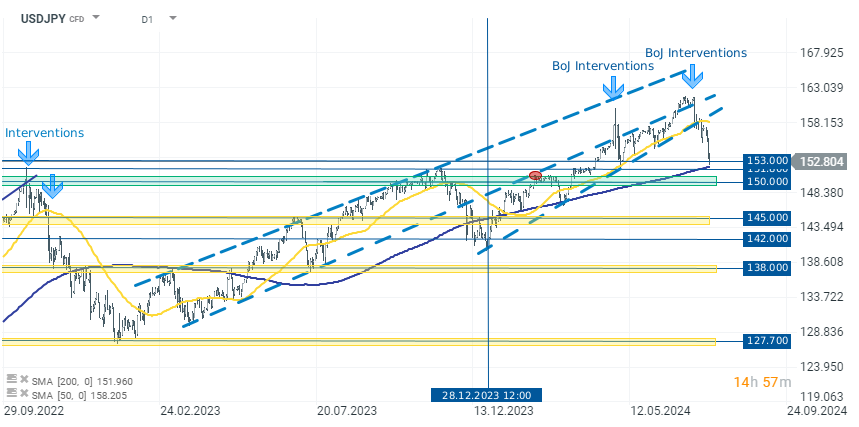
Source: xStation 5

Chart of the Day: เงินเฟ้อกดดัน AUDUSD! 'เหยี่ยว' RBA กำลังเปลี่ยนท่าที?
Economic Calendar: จับตาทุกเหตุการณ์สำคัญ! การตัดสินใจดอกเบี้ยของ Fed และผลประกอบการ Big Tech พร้อมเขย่าตลาด (29.07.2026)

Morning Wrap: ตลาดเอเชียเผชิญแรงขายจากผลประกอบการ SK Hynix และความตึงเครียดอิหร่าน ดอลลาร์หยุดชะลอความเคลื่อนไหวก่อนผลประชุม Fed

ข่าวเด่นวันนี้ 29 ก.ค.