
Costco unveiled its monthly sales report. The company achieved revenues of $78.2 billion in August, a year-on-year increase of 7.1%. This growth continues the trend that the company has been on for the last six quarters, with an average revenue growth rate of 6.5%.
Looking at comparable sales, the company achieved 5% revenue growth in August, with retail sales in the US and Canadian markets up 4.7% and 4.5%, respectively. The company has seen continued strong growth in its e-commerce sales segment, where sales rose 23% year-on-year.
If comparable sales are adjusted for the impact of fuel sales and currency movements, growth in August would have been 7.1% y/y, and 23.3% y/y in the e-commerce segment.
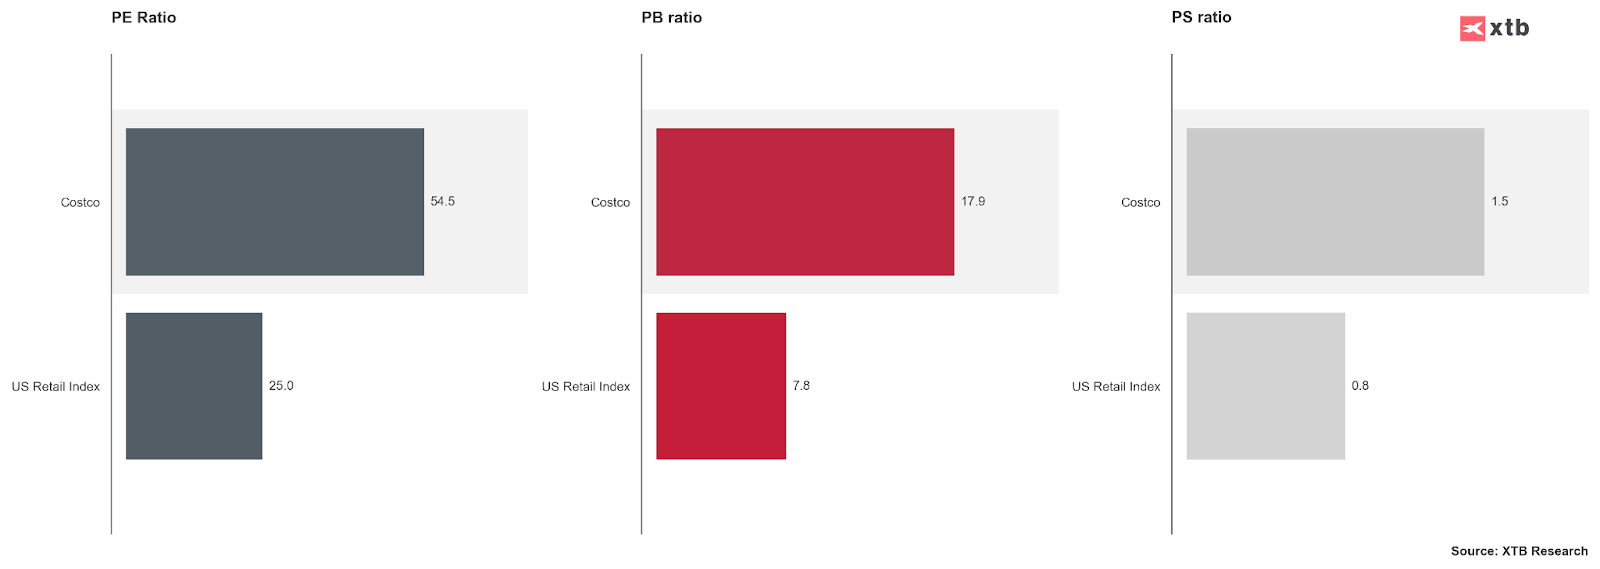
Costco remains trading at a significant premium to the rest of the US retail segment. The P/E ratio of 54.4x remains more than 2 times the value for the sector as a whole. On a P/BV and P/S ratio basis, the company also significantly outperforms its segment.
This situation has been going on for a long time, and looking at historical forward P/E ratios, Costco's ratio has exceeded the sector by an average of 1.78x and the entire S&P 500 index by 1.86x. Even with the trend of strong premium to index, current Costco values implies strong overvaluation.

Comparison of forward P/E ratios against historical values (top chart), the sector (middle) and the S&P 500 index (bottom). Source: Bloomberg Finance L.P.
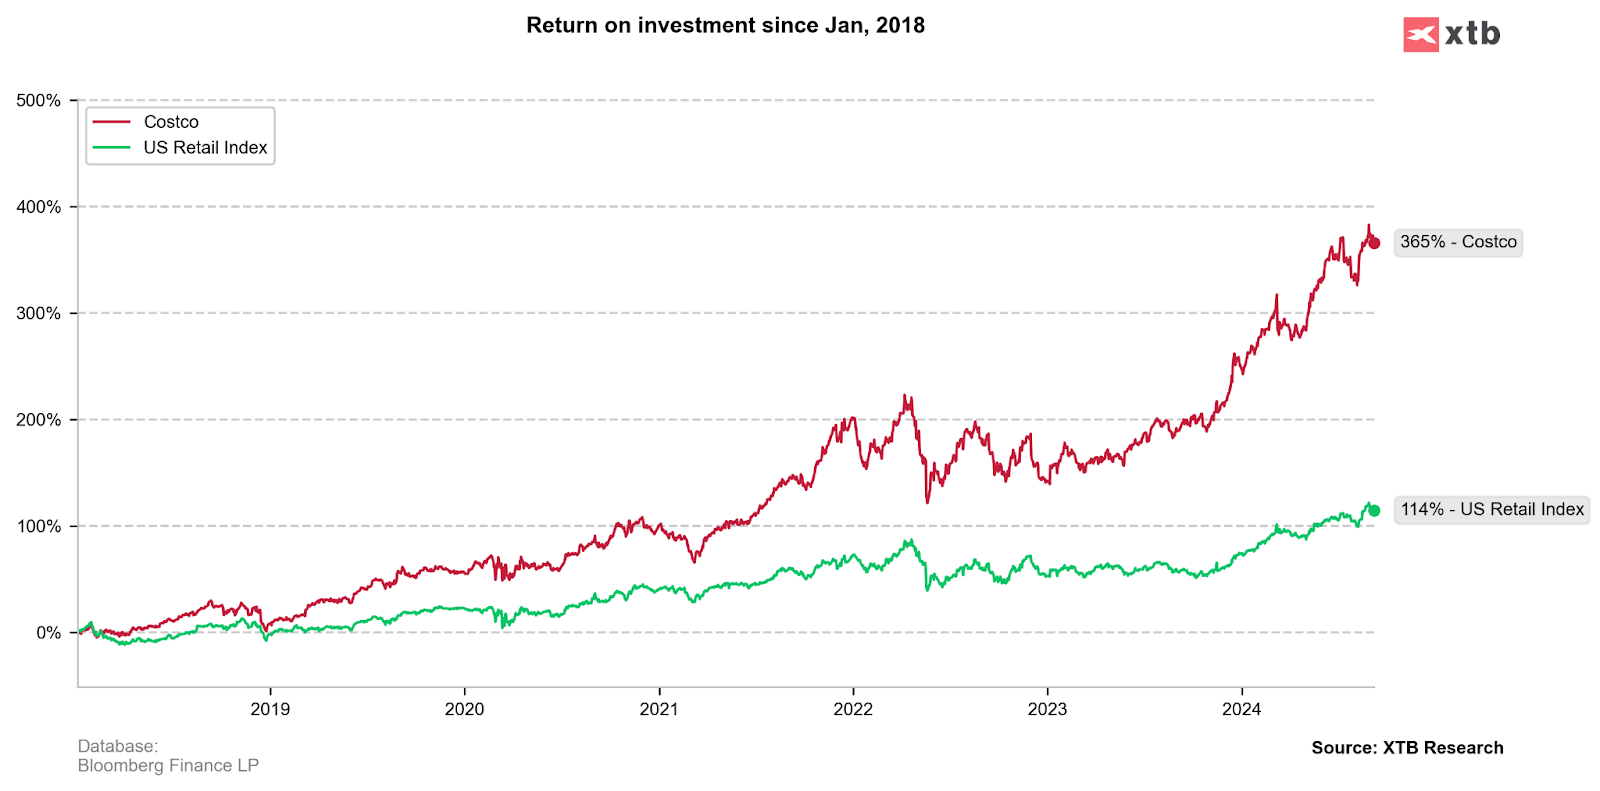
Although since the beginning of 2018 it has presented a return of 365% (compared to the sector's return of 114%) it is worth remembering that trading in the area of such high ratios exposes the company to potentially greater volatility in the event of disappointing post-performance data.

AI Stocks Slide 🚩 Dell ดิ่ง 11% หลังแรงขายถล่มหุ้น AI

Micron vs. Nvidia: ดาวรุ่ง AI รายใหม่ของ Wall Street พุ่ง 18 เท่าหลังยุค ChatGPT
Morgan Stanley โชว์งบไตรมาสสุดแกร่ง กำไรทุบสถิติ หนุน Wall Street Rally
หุ้น BlackRock พุ่ง 5% หลังประกาศงบ 🔼 วอลล์สตรีทรายงานอะไรบ้าง?