



Last week we ended up witnessing periods of high volatility in the markets, where equities in Europe enter in sell-off as well as U.S equities, although on a smaller scale compared to the European indices.
Interestingly, the EUR/USD pair ended up remaining stable and we even had the euro appreciate against the US dollar.
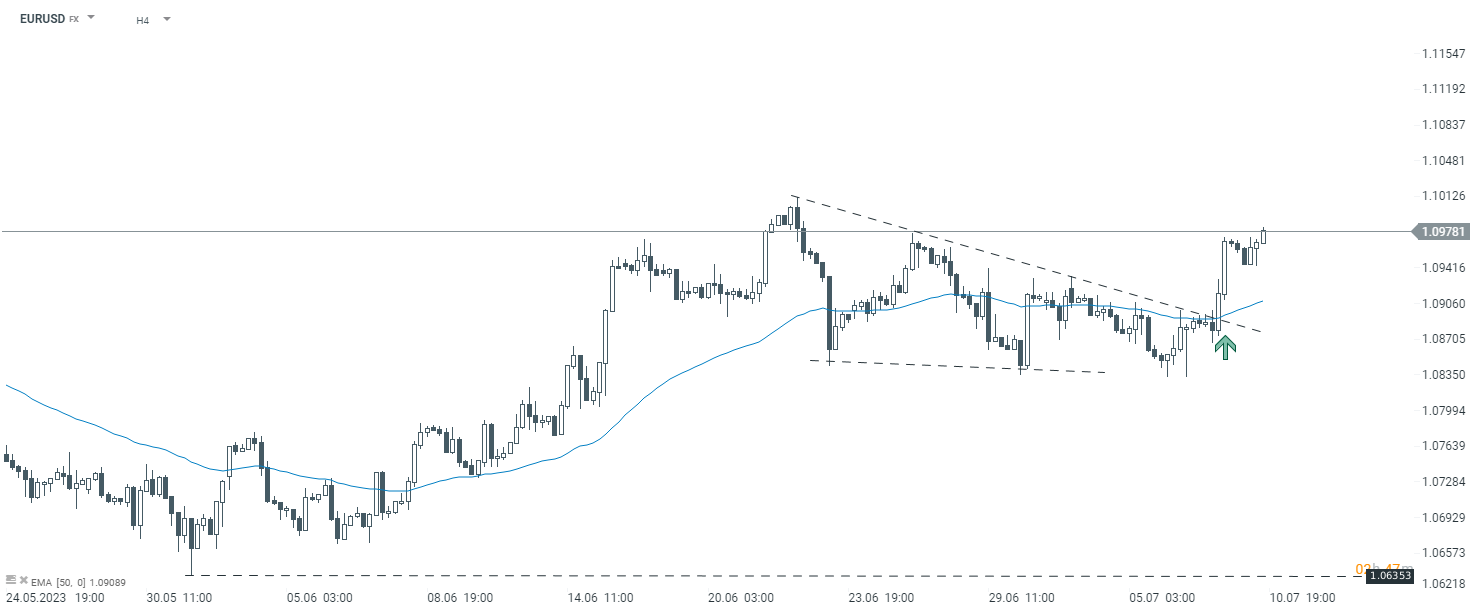
When we look at the 4-hour chart, we can see that the price has been trading in a technical structure that already anticipated a possible potential bullish momentum. This structure could maintain the current bullish momentum as long as the price remains above the structure.
EUR/USD 4 hours time frame chart. Source: xStation 5
On the chart of the US dollar index, it is also possible to see that the price has broken a technical structure that supported the down trend of the USD.
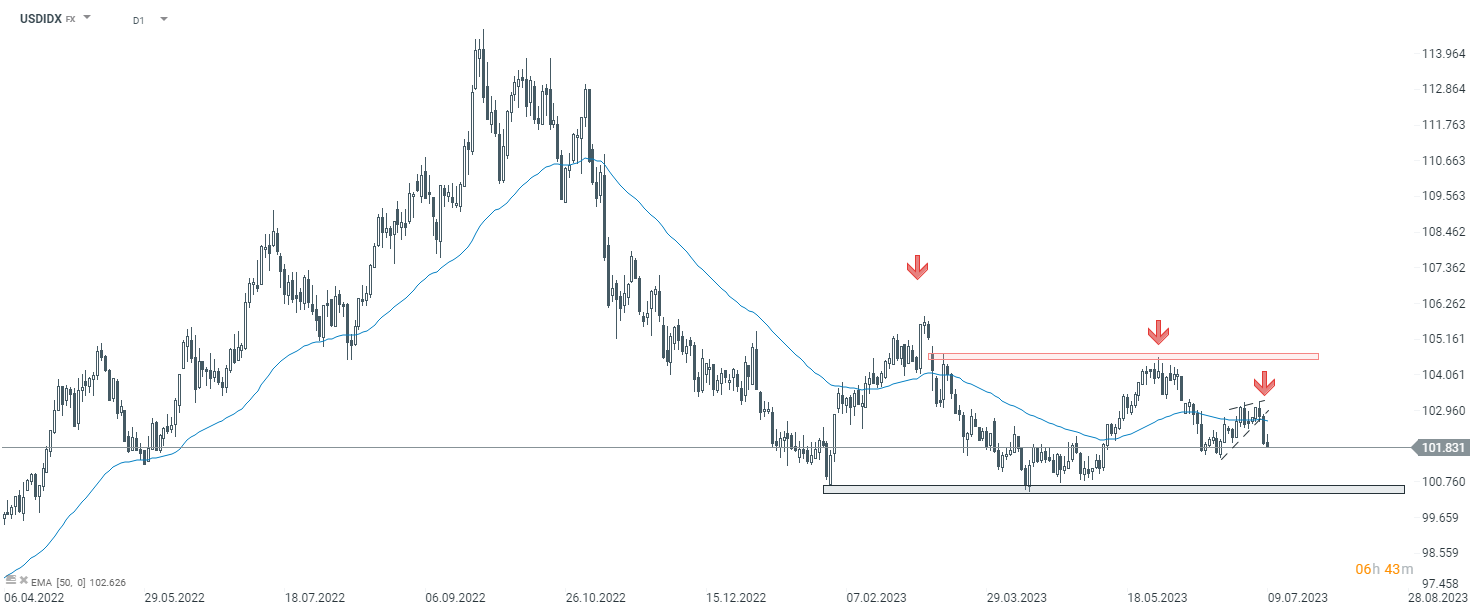 Daily time frame chart. Source: xStation 5
Henrique Tomé, XTB Portugal


🚨 ดัชนี ISM ภาคการผลิตสหรัฐฯ ต่ำกว่าคาด ดอลลาร์ผันผวนแรง

EURUSD ร่วงต่อ 📉 ราคาพลังงานที่พุ่งสูง กำลังกดดันเศรษฐกิจยุโรป?


⛩️ Chart of the Day: JP225 - Nikkei เดินตามจังหวะของตัวเอง


📉 NATGAS ร่วง 1.2% แล้วฤดูหนาวจะเป็นอย่างไร?