



The EUR/USD pair has become particularly volatile over the past few sessions. After the euro reached new highs this year against the US dollar, nearing 1.12 euros, the pair eventually started to decline again.
However, when we analyze the currency pair on the daily chart, we can see that the price has been slowing down, and the buying strength is picking up near the 50-period EMA (Exponential Moving Average). This will be an important zone to understand whether the euro might (or might not) resume its upward trend against the US dollar.
 EUR/USD, Daily Time Frame Chart. Source: xStation 5
Curiously, when we analyze the chart of the US dollar index, we can see that the index is also testing the 50-period moving average on the D1 (daily) chart.
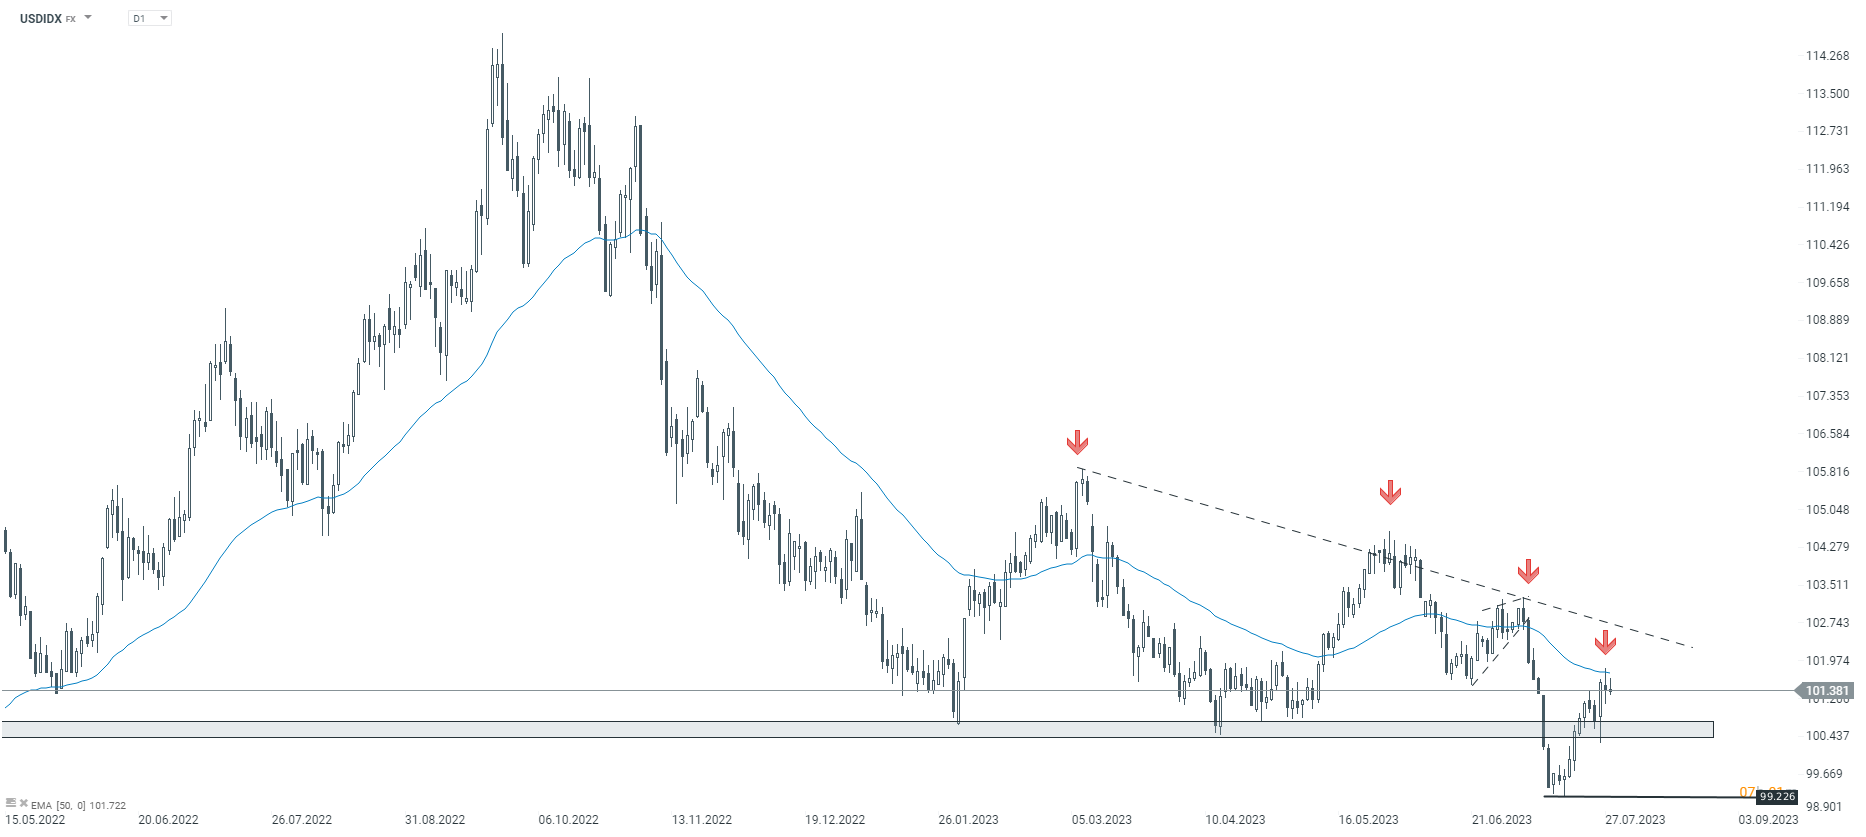 USDIDX, Daily time frame Chart. Source: xStation 5
Henrique Tomé,
Analyst at XTB Portugal



แรงเทขายหุ้นเทคโนโลยีกดดันตลาด ขณะที่ Fed เผยฉากทัศน์ผลกระทบจาก AI


เศรษฐกิจยุโรปและเอเชียส่งสัญญาณอ่อนแอ ตลาดจับตา Warsh


⚪ Chart of the Day: เงินแท่งทดสอบจุดต่ำสุดของปี ขณะที่ปัจจัยพื้นฐานยังคงอ่อนแอลง


GOLD แนวรับ 3,850 จะยืนไหวหรือไม่?