
Oil continues to climb higher with WTI briefly trading above $83 earlier this week and Brent testing $86 mark. Crude prices pulled back during the Asian session. There can be few reasons behind the move. Firstly, Chinese authorities teamed up with coal producers to lower price of the commodity. While the move is mostly targeted at lowering the price of coal and steel, oil and industrial metals are also taking a hit. Secondly, the rally on the natural gas market was halted. Last but not least, the API report released yesterday evening showed a much bigger than expected build in oil inventories (3.3 mb vs 1.7 mb expected). Question is whether today's DOE report will confirm this. In any case, higher volatility on the oil market may be expected today near the release hour (3:30 pm BST).
Taking a look at OIL.WTI chart at H1 interval, we can see that price is once again testing 100-period moving average that acts as a support. Should bulls manage to defend this technical level once again, another upward impulse cannot be ruled out. However, even if we see a break below this moving average, it will be key whether the price breaks below the $81.25 support zone, marked with a 23.6% retracement of the upward move started on October 7, 2021.
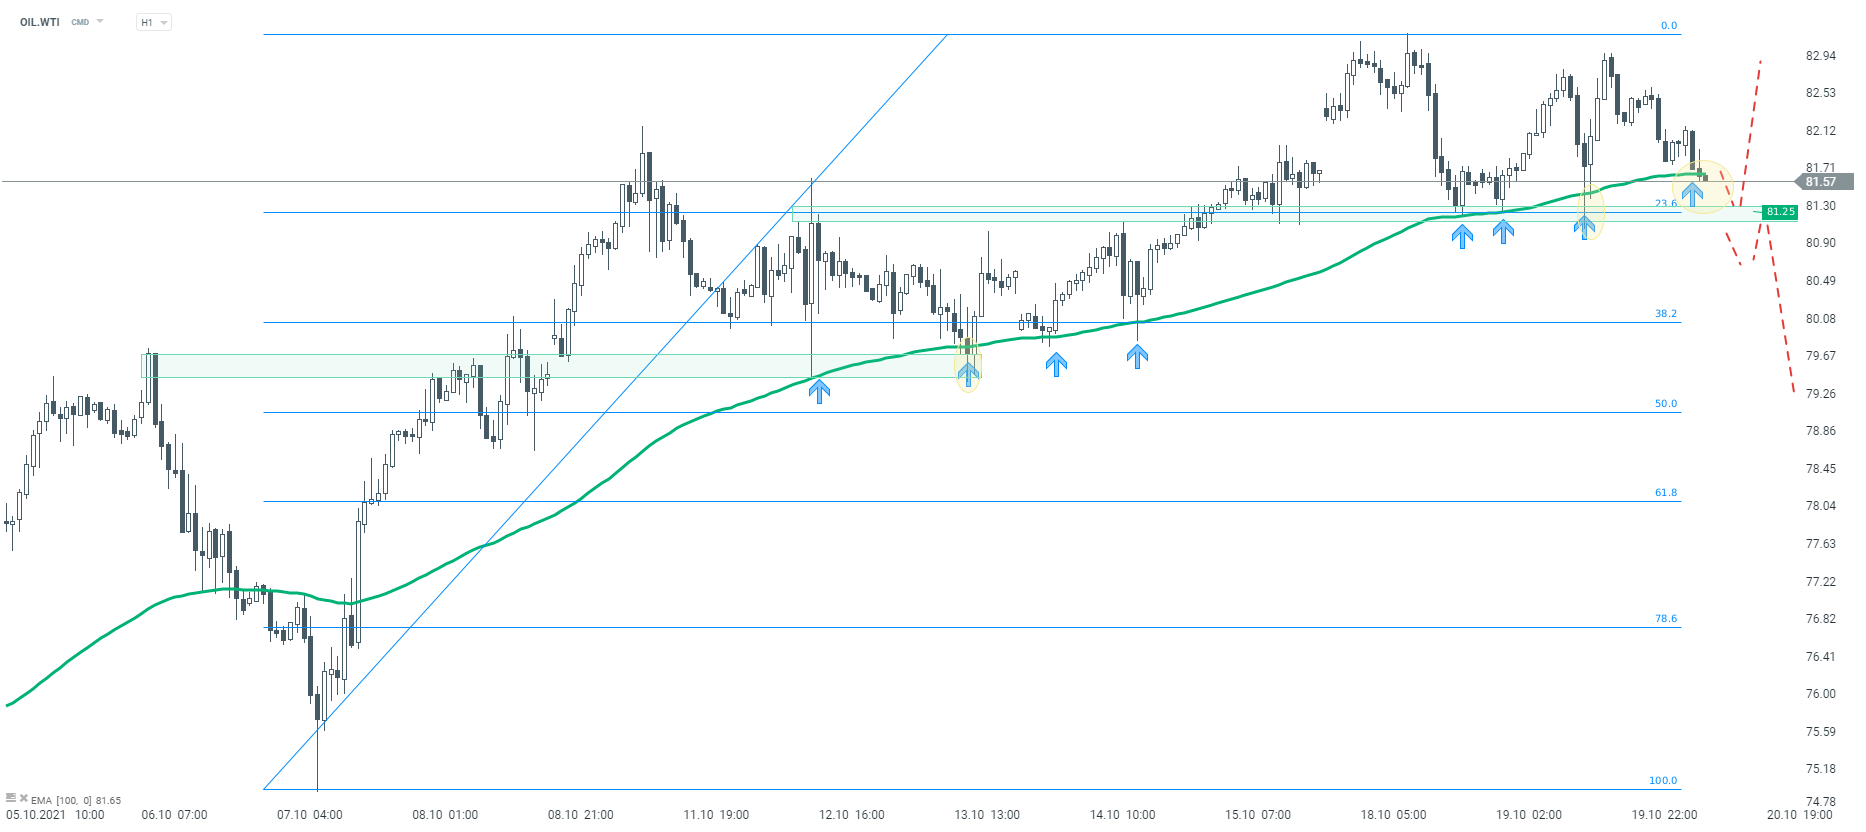 Source: xStation5

مخطط اليوم 🚩 انخفض سعر النفط من 80 دولارًا رغم التوترات بين الولايات المتحدة وإيران. ما الذي سيحدث لاحقًا؟

حصاد الأسواق 🚩 وول ستريت تقاوم ضغوط النفط وسط تصاعد التوترات في الشرق الأوسط (09.07.2026)

ملخص يومي - تصعيد في الشرق الأوسط. لجنة السوق المفتوحة الفيدرالية تخشى التضخم

زيارة ترامب لأنقرة لا تُشير إلى تصعيد كامل. النفط يحد من المكاسب، ومؤشر ناسداك يُخفف من الخسائر.