
Recently, we can observe mixed sentiment in the US stock market. Let's take a look at the technical situation on the US2000. Looking at the H4 interval, we can distinguish two key zones. The resistance is located at 2252 pts, while the major support lies at 2195 pts, and only breaking any of these levels can trigger a bigger move. As for the Overbalance methodology, it still favors buyers - index has recently bounced off the lower limit of the 1: 1 structure and then reached new local high. In the case of the bullish scenario, the next resistance is located around 2,293 pts and is marked with the 78.6% Fibonacci retracement of the last downward wave.
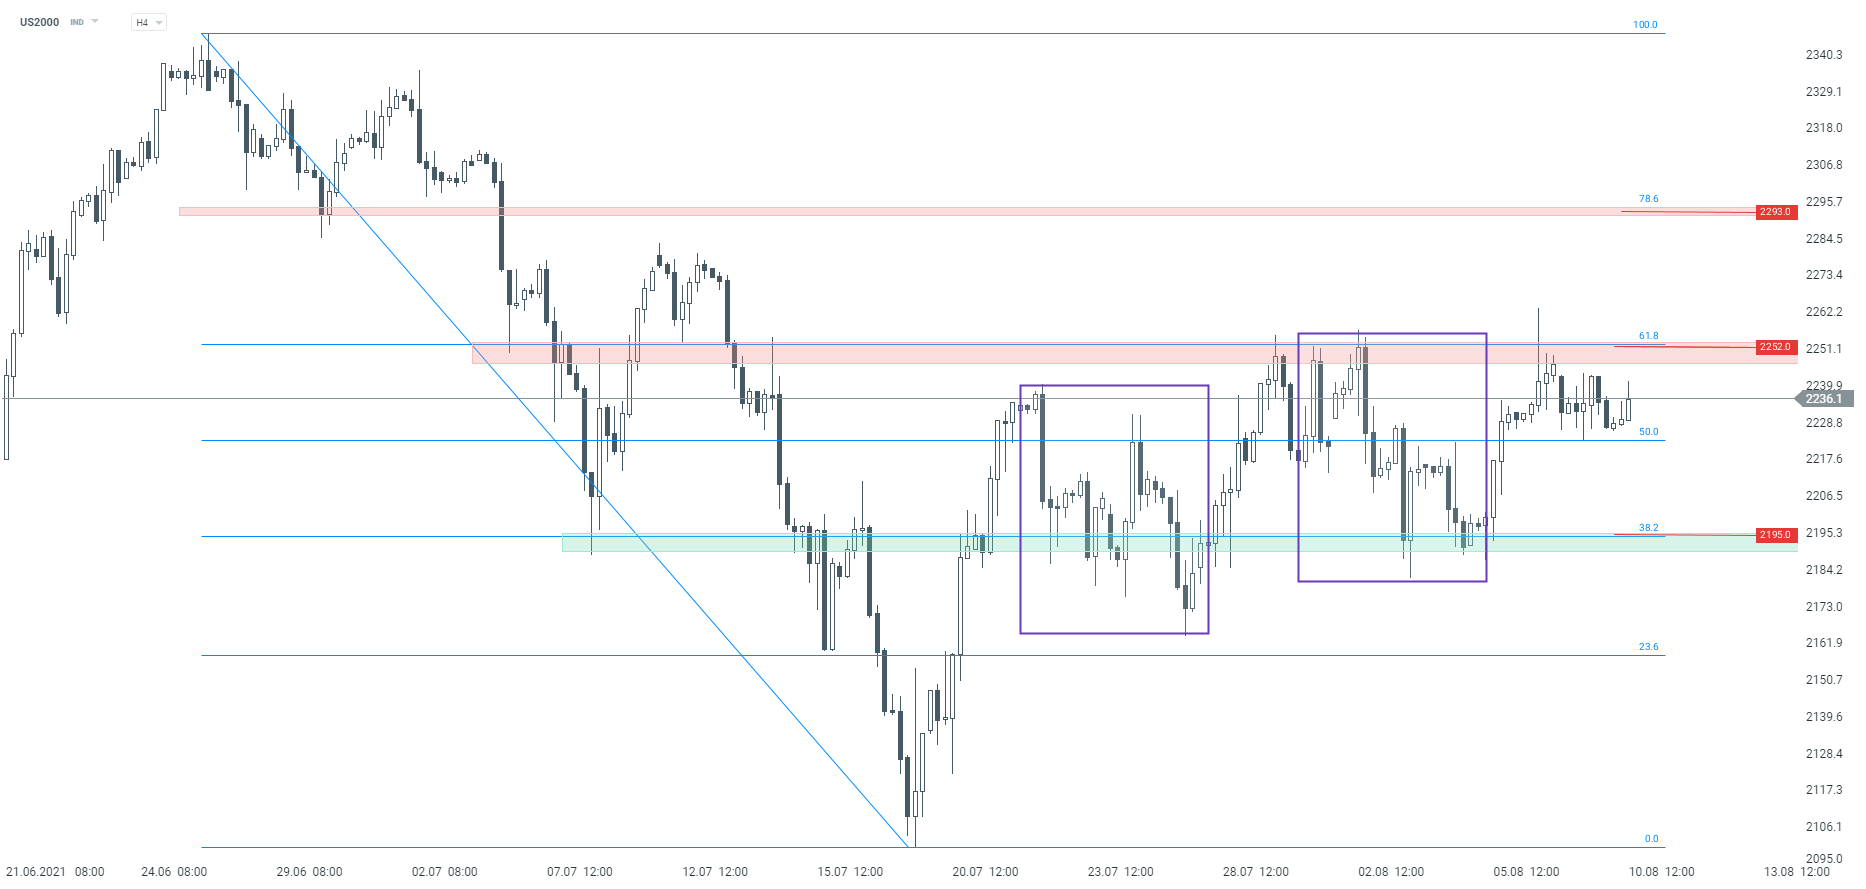 US2000 interval H4. Source: xStation5

ملخص اليوم: وول ستريت تستعيد عافيتها؛ تدخل جديد في سوق الين؟

ثلاثة أسواق يجب مراقبتها الأسبوع المقبل (31 يوليو 2026)

ملخص السوق: الأسهم الأوروبية تسجل أعلى مستوياتها في ثلاثة أسابيع! انخفاض سهم أبل في تداولات ما قبل افتتاح السوق الأمريكية!

التقويم الاقتصادي: أهم قراءات مؤشر أسعار المستهلكين الأوروبي وأرباح شركات النفط العملاقة