
US, data pack for June:
- PCE price index y/y: 3.0% vs 3.0% exp. and 3.8% previously
- PCE price index m/m: 0.2% vs 0.2% exp and 0.1% previously
- Core PCE y/y: 4.1% vs 4.2% exp and 4.6% previously
- Core PCE m/m: 0.2% vs 0.2% exp and 0,3% previously
- Consumer spending data: 0.5% vs 0.4% exp and 0.1% previously
In June, personal income increased by $69.5 billion (0.3% monthly rate), with disposable personal income (DPI) rising by $67.5 billion (0.3%) and personal consumption expenditures (PCE) increasing by $100.4 billion (0.5%). The PCE price index rose by 0.2%, and excluding food and energy, it also increased by 0.2%. Real DPI and real PCE both experienced growth, with goods increasing by 0.9% and services by 0.1%. The rise in current-dollar personal income was mainly due to increased compensation, partially offset by a decrease in personal income receipts on assets. The $100.4 billion increase in PCE was driven by higher spending on services and goods, with notable contributions from financial services, housing, utilities, and motor vehicles.
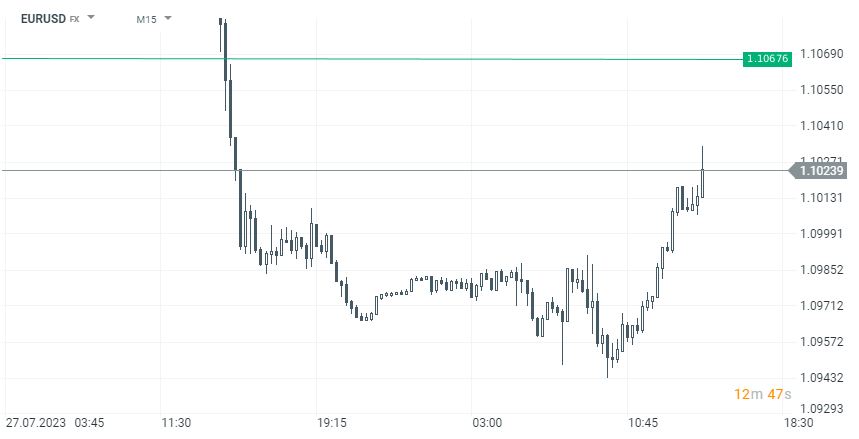
EURUSD, M15 interval, source xStation 5
ด่วน: 🇬🇧 GBPUSD ปรับตัวขึ้น 0.1% หลัง GDP ของสหราชอาณาจักรออกมาดีกว่าคาด 📈
Morning Wrap: ตลาดเอเชียปรับตัวลงตามแรงขายหุ้นเซมิคอนดักเตอร์สหรัฐฯ จับตาผลประกอบการ TSMC

ข่าวเด่นวันนี้ 16 ก.ค. : Wall Street ปรับตัวขึ้น Dow Jones ใกล้ทำจุดสูงสุดใหม่ หลัง PPI ต่ำกว่าคาด

BREAKING: PPI สหรัฐฯ ยืนยันเงินเฟ้อชะลอตัวตามทิศทาง CPI