
01:30 PM GMT, United States - Inflation Data for January:
- Personal Income: actual 1.0% MoM; forecast 0.4% MoM; previous 0.3% MoM;
- PCE price index: actual 0.3% MoM; forecast 0.3% MoM; previous 0.1% MoM;
- Personal Spending: actual 0.2% MoM; forecast 0.2% MoM; previous 0.7% MoM;
- Core PCE Price Index: actual 2.8% YoY; forecast 2.8% YoY; previous 2.9% YoY;
- Core PCE Price Index: actual 0.4% MoM; forecast 0.4% MoM; previous 0.1% MoM;
01:30 PM GMT, United States - Employment Data:
- Initial Jobless Claims: actual 215K; forecast 209K; previous 202K;
- Jobless Claims 4-Week Avg.: actual 212.50K; previous 215.50K;
- Continuing Jobless Claims: actual 1,905K; forecast 1,874K; previous 1,860K;
For the week ending February 24, the U.S. saw an increase in initial jobless claims to 215,000, up 13,000 from the prior week, and a slight upward revision in the previous week's data. The four-week moving average decreased slightly. Meanwhile, the insured unemployment rate rose to 1.3%, with the number of people receiving unemployment benefits increasing to 1,905,000, marking the highest four-week average since December 2021.
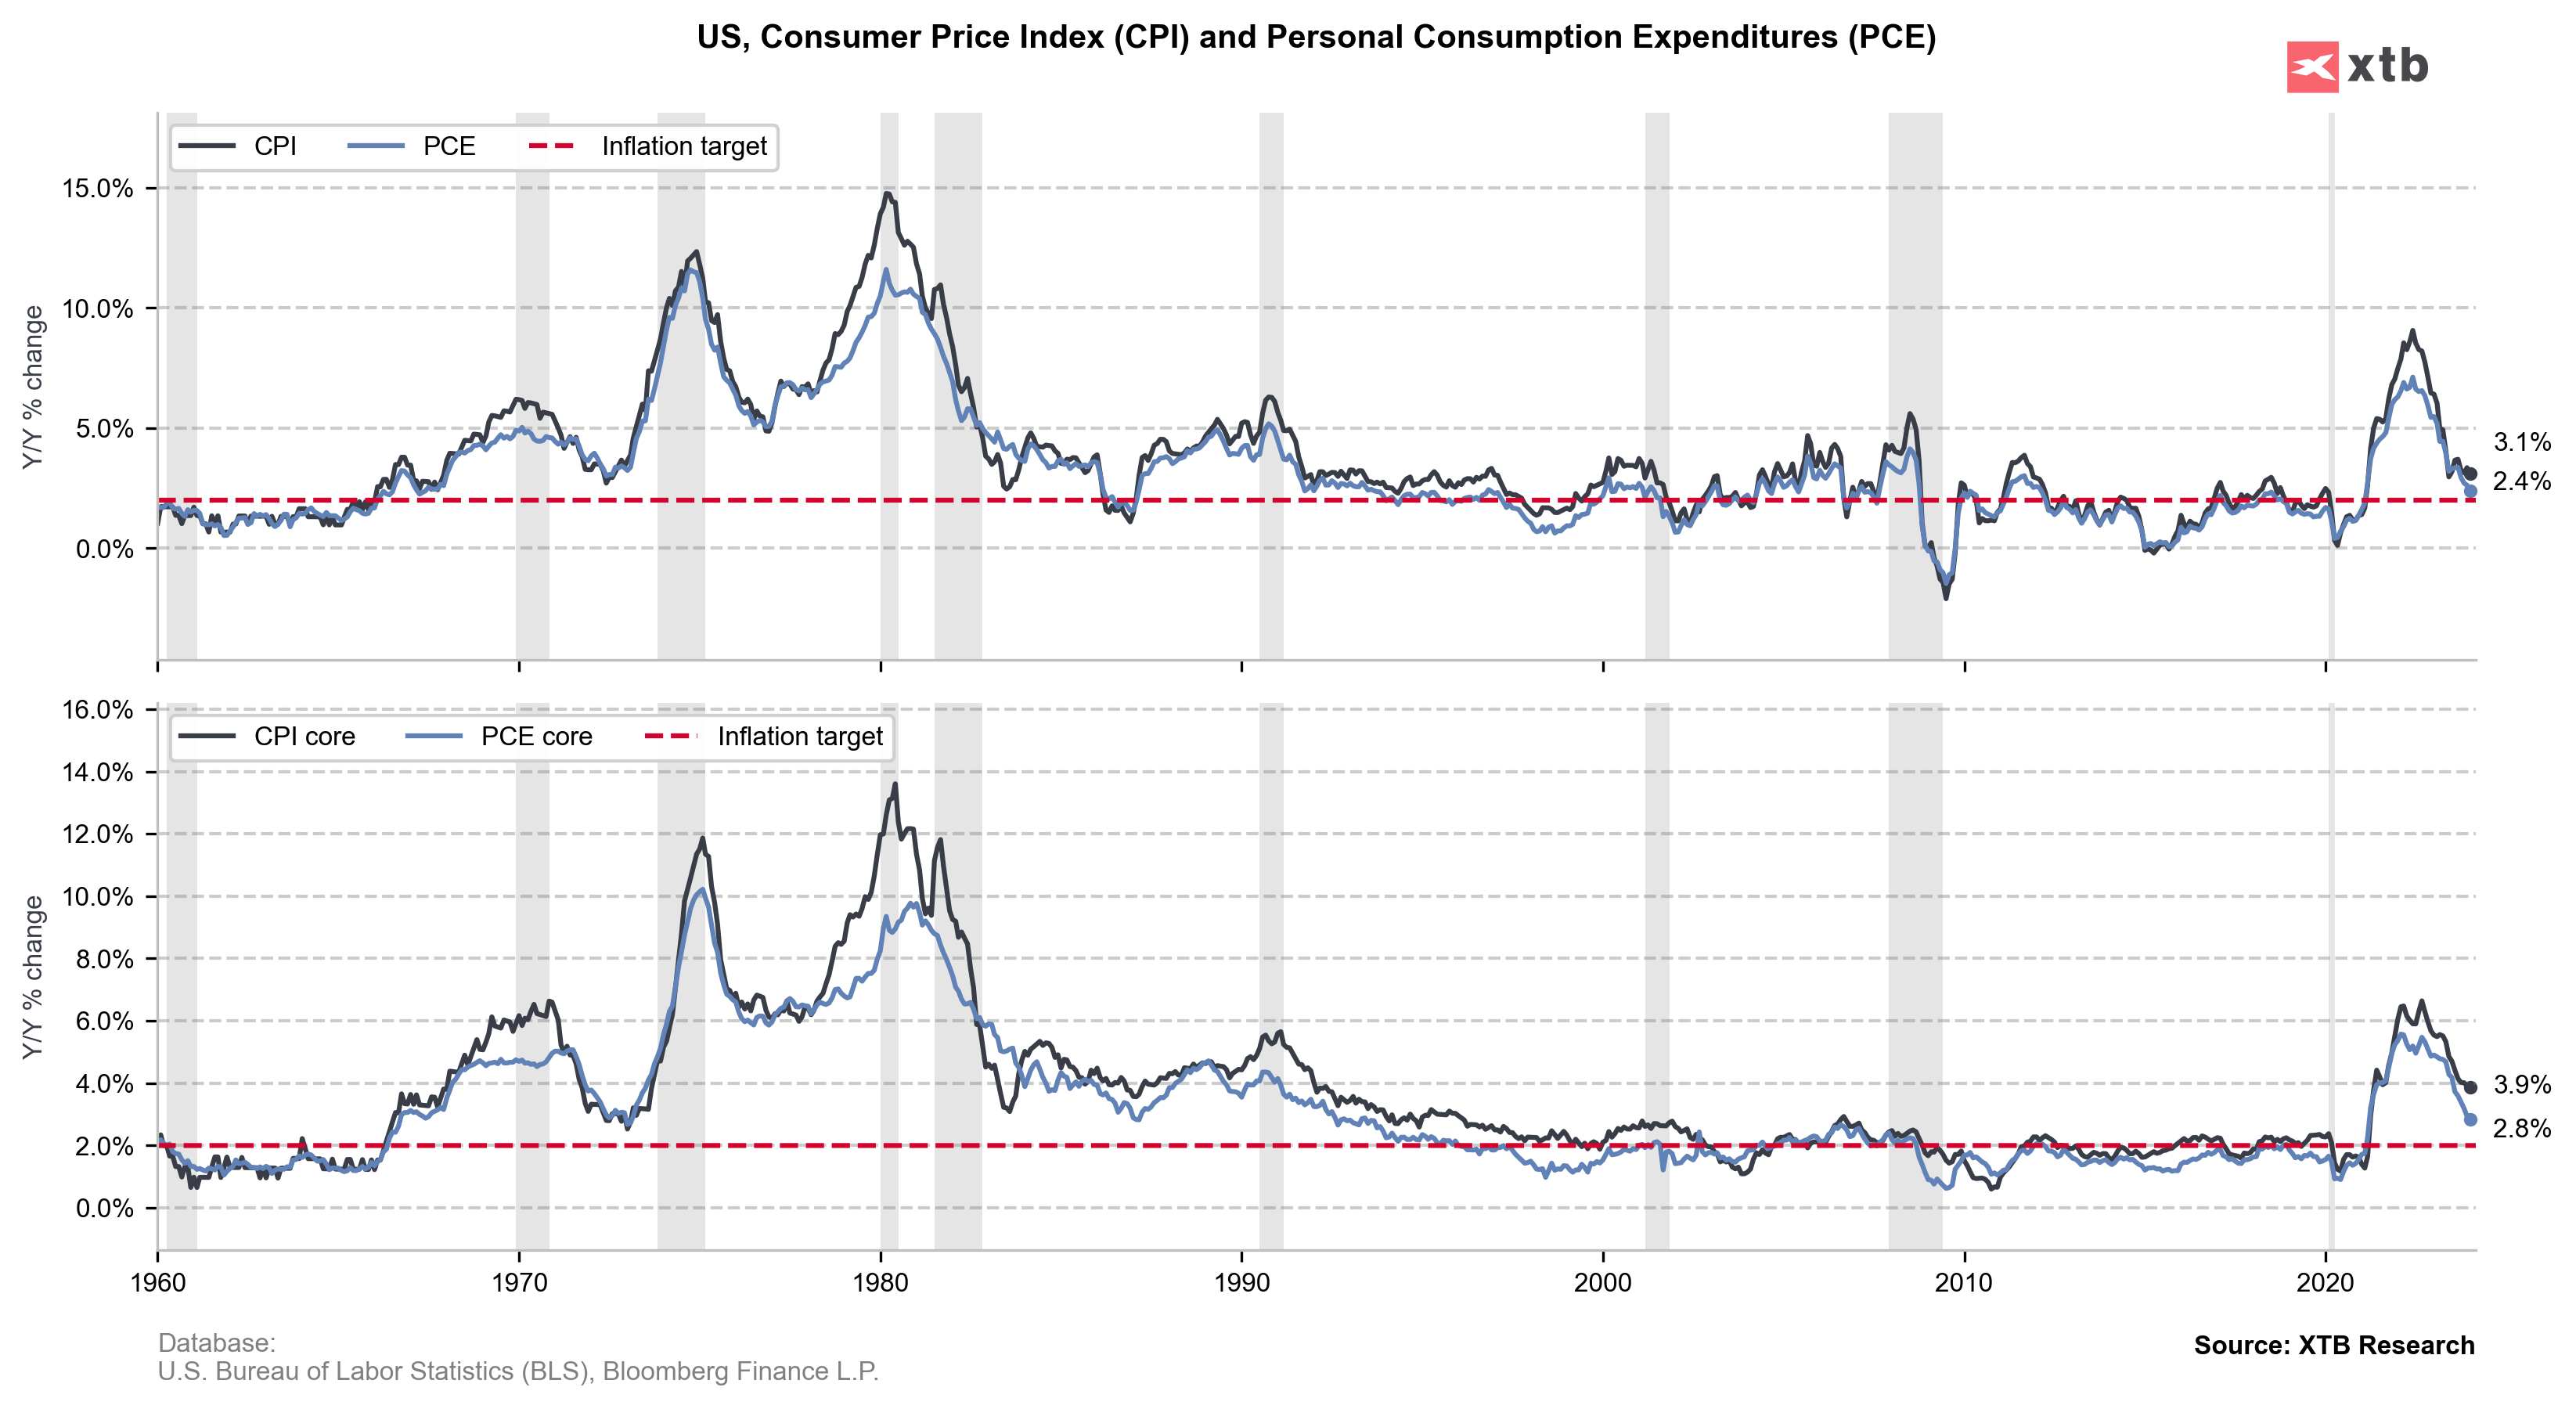
In January 2024, U.S. personal income rose by $233.7 billion (1.0%), with disposable personal income (DPI) increasing by $67.6 billion (0.3%) and personal consumption expenditures (PCE) going up by $43.9 billion (0.2%). The PCE price index saw a 0.3% increase, excluding food and energy. Real DPI slightly decreased, while real PCE dropped by 0.1%, reflecting a decline in goods spending and an increase in services. The rise in personal income was mainly driven by higher government social benefits, asset income, and compensation, with significant increases in social security benefits and Affordable Care Act enrollments. The increase in PCE was due to higher service spending, offset by a reduction in goods spending, particularly in motor vehicles and energy goods. Personal outlays rose by $54.3 billion, with a personal saving rate of 3.8%. Year-over-year, the PCE price index increased by 2.4%, with a notable rise in service prices and a decrease in goods prices.
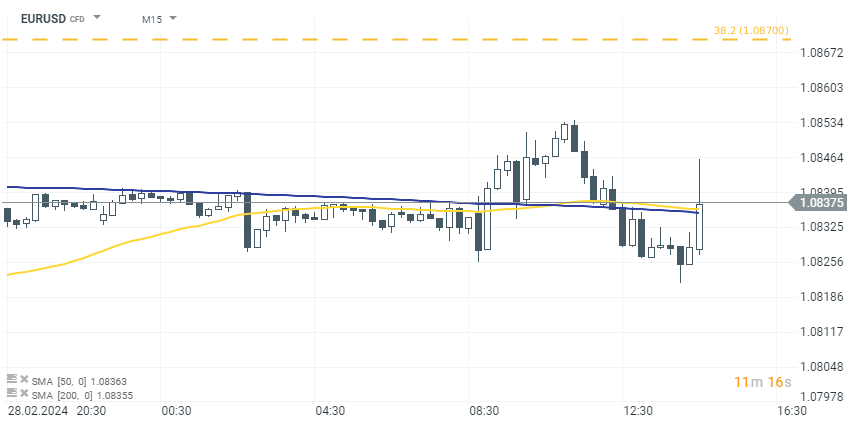
Source: xStation 5

Economic Calendar: จับตาผลประกอบการ ยอดค้าปลีกสหรัฐฯ และถ้อยแถลง Fed ชิงความสนใจนักลงทุน

ด่วน: 🇬🇧 GBPUSD ปรับตัวขึ้น 0.1% หลัง GDP ของสหราชอาณาจักรออกมาดีกว่าคาด 📈

ข่าวเด่นวันนี้ 16 ก.ค. : Wall Street ปรับตัวขึ้น Dow Jones ใกล้ทำจุดสูงสุดใหม่ หลัง PPI ต่ำกว่าคาด

Figure of the Day: สกุลเงินที่แข็งแกร่งที่สุดของเดือนกรกฎาคม จะไปต่อหรือไม่?