
The cryptocurrency market saw a rebound on Saturday after four days of intense declines. Bitcoin temporarily gained over 4.00%, reaching around $58,000. However, on Sunday, the bears regained control, erasing Saturday's gains. Today, in the first part of the day, we are seeing a deepening of the declines.
Currently, Bitcoin's price is almost 13% below the current realized price for short-term investors (addresses holding BTC for less than six months), signaling a certain level of capitulation. Additionally, on Friday, US ETFs recorded their first significant net inflows in several sessions, totaling $143 million, the highest net value in nearly a month.
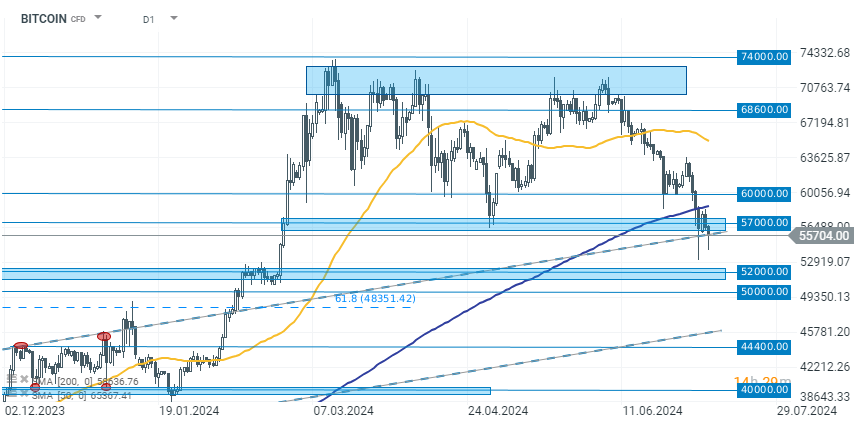
From a technical analysis perspective, Bitcoin is not in the best formation. The continuation of declines after a brief consolidation around $57,000 may indicate weakness among buyers. The next nearest support level remains around $50,000-$52,000. The correction in Bitcoin since marking a double top has already exceeded 22%. Historically, in the post-halving period, declines have reached up to 30%, which would also suggest a potential range for the current move to levels around $50,000-$52,000.
Source: xStation 5

📈 Bitcoin ขยับขึ้นเหนือระดับ $62K
Bitcoin เข้าสู่ภาวะตลาดหมี: สรุปภาพรวมตลาดคริปโตประจำไตรมาส
🚩 BlackRock เทขาย Bitcoin! BTC หลุด $60K แล้วจะเกิดอะไรต่อ?

ข่าวเด่นวันนี้ 23 มิ.ย.