
While stocks in Europe and the United States managed to recover somewhat from last week's declines, indices from China continue to underperfom. Chinese index CHNComp took a hit following the release of the lacklustre monthly data for August from the country.
-
Retail sales: 2.5% YoY vs 7.2% YoY expected
-
Industrial production: 5.3% YoY vs 5.8% YoY expected
-
Urban investments: 8.9% YoY vs 9.2% YoY expected
While it was expected that data for August may be a bit softer due to reintroduction of pandemic restrictions in some regions as well as weaker reading of PMI indices, a massive miss in the retail sales data caught markets off guard.
Taking a look at the index from a technical point of view, we can see that CHNComp continues pullback launched after a failed attempt of breaking above the 9,500 pts resistance. Index is closing in on the support zone ranging above 8,700 pts mark and serving as the lower limit of a current trading range. Note that downtrend structure has not been broken on the index yet therefore traders should be aware of a possible downside breakout from the trading range.
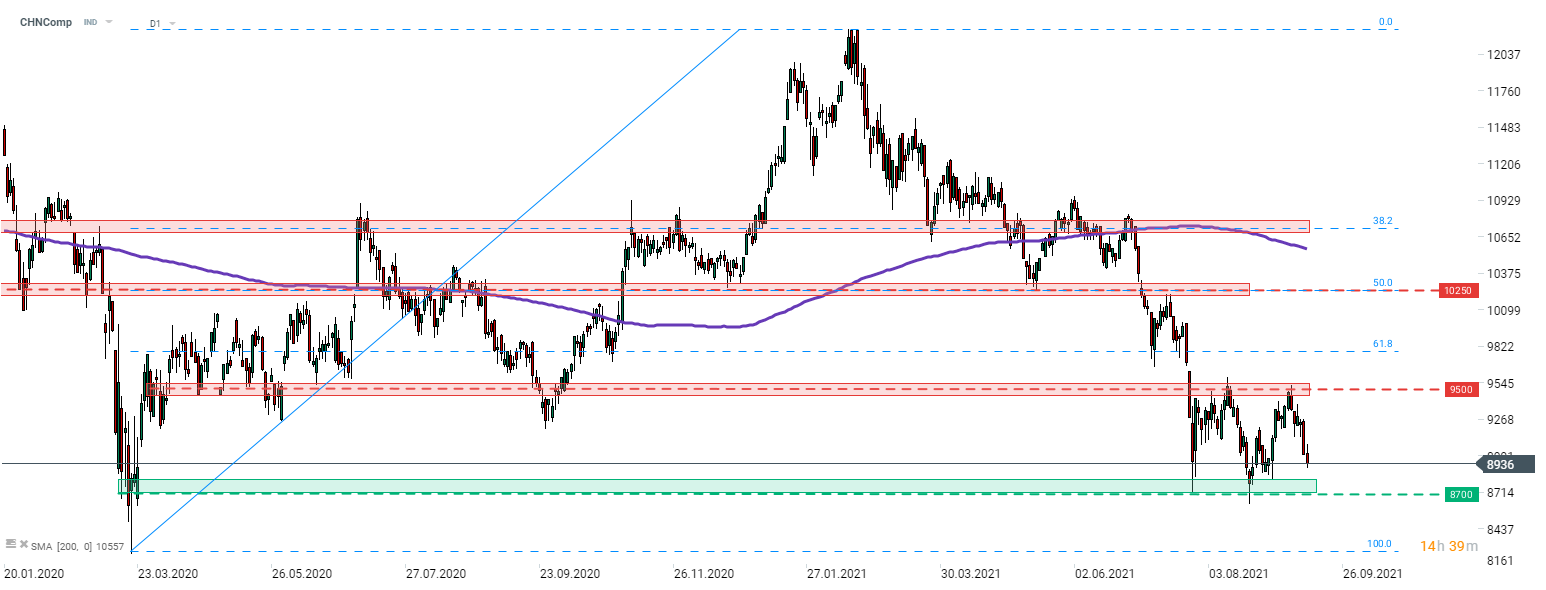 Source: xStation5

ตลาดยุโรปอ่อนตัวจากความตึงเครียดสหรัฐฯ - อิหร่าน 📉 หุ้นเซมิคอนดักเตอร์ถูกกดดัน

📉 US100 ร่วง 1.5%

ปฏิทินเศรษฐกิจวันนี้: เงินเฟ้อยุโรปและภาคอสังหาฯ สหรัฐฯ เป็นไฮไลต์

Morning Wrap: แรงขายกดดันวอลล์สตรีท AI หมดโมเมนตัม Netflix สะดุด อ่าวเปอร์เซียลุกเป็นไฟ