
European stock markets indices launched today's trading lower but has managed to recover the majority of losses later on. However, a caution is needed as a common scheme could be spotted in European equity price action in recent days. Namely, indices from the region tended to launch cash sessions lower and recover during the European trading hours before turning lower in the afternoon trade. Traders should stay on guard and look for possible hints of sentiment changing ahead or near the Wall Street session opening bell.
Taking a look at Euro Stoxx 50 chart (EU50), we can see that a drop during the Asian session today was halted slightly above the support zone ranging above the 50% retracement of the post-pandemic upward move (3,325 area). A subsequent recovery move pushed the price back towards the resistance zone marked with 38.2% retracement in the 3,580 area. A break above this hurdle could boost odds for a longer-lasting recovery move. However, it should be noted that technical setup looks somewhat bearish with the index trading below Overbalance structure and finishing yesterday's trading over 20% below 2021 highs.
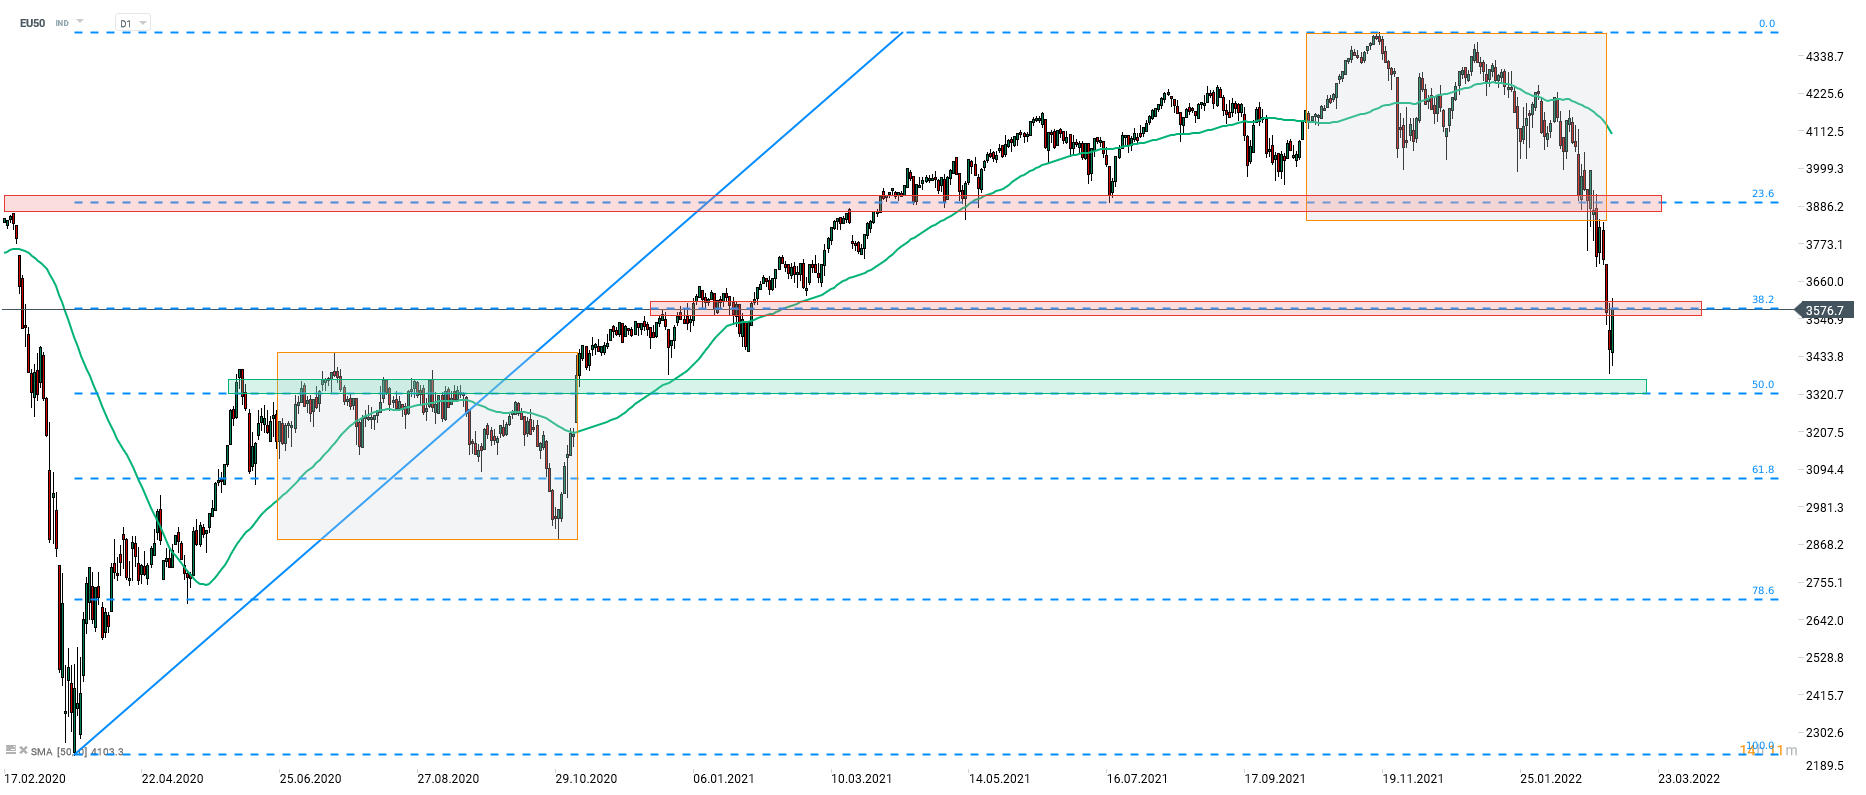 Source: xStation5

สรุปตลาดประจำวัน: สงครามชิปกดดัน Wall Street ขณะที่น้ำมันร่วงแรง หลังสหรัฐฯ–อิหร่านบรรลุข้อตกลงหยุดยิง ⭐

Nasdaq-100 ถูกกดดัน หลังหุ้นกลุ่มชิปร่วงลง

จีนพัฒนาเครื่องผลิตชิปของตัวเอง กดดัน ASML ท่ามกลางสงครามเทคโนโลยีระลอกใหม่

Morning Wrap: น้ำมันร่วงแรงต่อเนื่อง หลังสุดสัปดาห์ 💥