Today, volatility on the EURUSD may accelerate because markets await speeches by Christine Lagarde, head of the ECB, and Fed chair Powell (both on Sintra summit 4:30 PM BST). Earlier, Luis de Guindos of the ECB will also speak (11:00 PM BST). Recent macro data from the EMU has been weak, with Germany's economy catching a very serious recessionary slowdown, especially in manufacturing. Monday's lower-than-forecast German Ifo business reading was 'supported' today by a weaker GfK consumer sentiment reading of -25.4. Markets expected improvement to -23 from -24.4 previously. It is still uncertain whether further rate hikes will really manage to significantly strengthen the Eurodollar.
Lagarde communicated yesterday that a 25bp hike in July is almost certain - there is little chance she would surprise the market with anything today. Powell, on the other hand, did not speak for a bit longer, and yesterday's strong macro readings may prompt the Fed chief to maintain a rather hawkish stance. Although the Fed is arguably closer to the end of the cycle than the ECB, which has reacted belatedly to inflation, data from EMU has been much weaker than readings from the US. This could mean that a hawkish turn in the ECB's ultra-dovish policy (unlike the Fed, ECB rates have not been raised from 2009 to 2022 except in 2011) could ultimately cost Europe more economic stress from higher rates (highest since 2001). The market seems unsure whether the economy can withstand the cycle with as much force as it has so far in the US. Yesterday's macro data from the US turned out to be surprisingly strong.
The EURUSD rate reached the zone where very strong supply has been triggered in recent months. We can also see that each time as we approached 1.10 the bears eventually took control. The key support on the Eurodollar is at 1.073 where we see the SMA200 on the D1 interval and the 23.6 Fibonacci retracement of the upward wave from the autumn, last year. A drop below the SMA100 (black line) at 1.084 could indicate an imminent test of these levels. Another key level set by the Fibo and price reactions is 1.05 where we see the 38.2 abolition. If sellers take control, we may see an RGR-like formation on the chart - a downward scenario, could reverse the medium-term trend.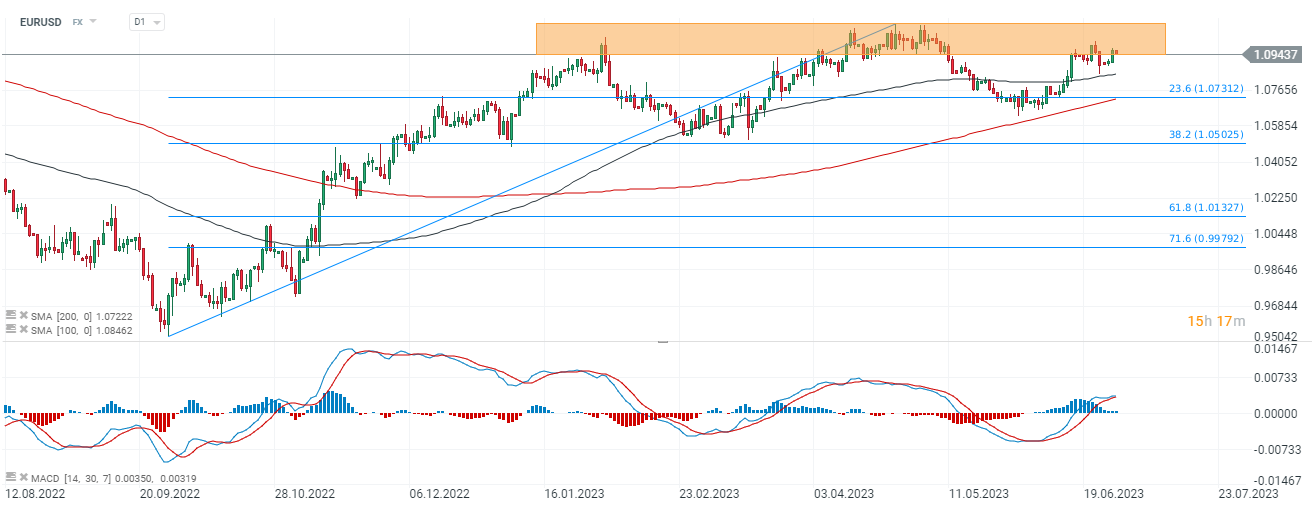
Source: xStation5

BREAKING: เศรษฐกิจยูโรโซนฟื้นตัว? PMI สดใส แต่ราคาน้ำมันและก๊าซสูงยังเป็นแรงกดดัน

Economic Calendar: ภาคอุตสาหกรรมเผชิญแรงกดดันจากราคาน้ำมัน

ข่าวเด่นวันนี้ 24 ก.ค.

Economic Calendar: จับตาผลประกอบการ Tesla และ Google