
UK inflation data for January was released today at 7:00 am GMT. Release showed a bigger slowdown in price growth than expected, with headline CPI gauge moving down from 10.5 to 10.1% YoY (exp. 10.3% YoY). Core gauge dropped from 6.3 to 5.8% YoY (exp. 6.2% YoY). Unsurprisingly, lower inflation reading was taken as dovish with investors increasing bearish BoE bets. This, in turn, triggered a pull back on GBP market.
Taking a look at GBPJPY chart at H4 interval, we can see that the pair has managed to climb above the resistance zone ranging below 38.2% retracement of the downward move launched in October 2022 recently but this breakout was short-lived. Pair pulled back below it this morning but has bounced off the daily lows and it looks like another attempt to break above 38.2% retracement may be on the cards. However, if bulls fail and bears regain control, a deeper correction may be on the cards. In such a scenario, 156.76 zones will be a key support to watch. However, 23.6% retracement in the 159.30 area may also provide some support given that it saw numerous price reactions over the past 2 months.
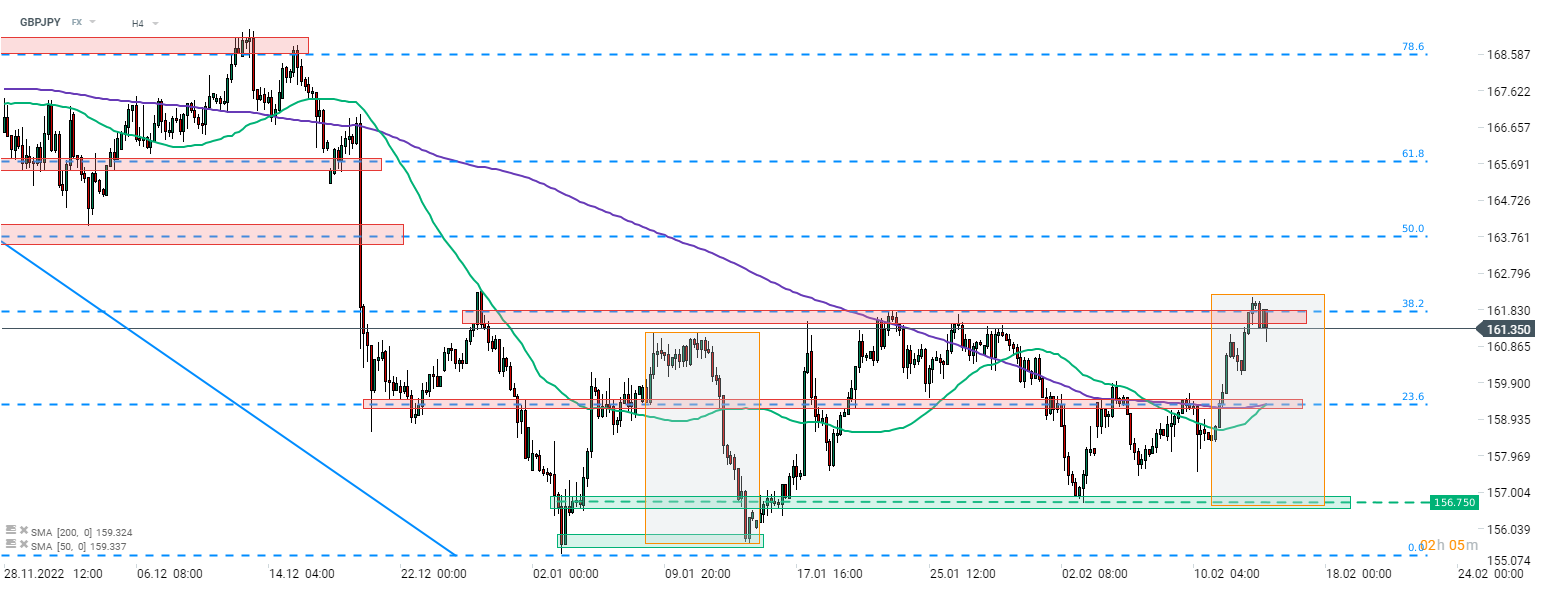 Source: xStation5

BREAKING: เศรษฐกิจยูโรโซนฟื้นตัว? PMI สดใส แต่ราคาน้ำมันและก๊าซสูงยังเป็นแรงกดดัน

Economic Calendar: ภาคอุตสาหกรรมเผชิญแรงกดดันจากราคาน้ำมัน

ข่าวเด่นวันนี้ 24 ก.ค.

Economic Calendar: จับตาผลประกอบการ Tesla และ Google