
Gold, as well as other precious metals, are trading lower today. Fed Chair Powell repeated his suggestions during a weekend interview that the March meeting may be too soon for the first rate cut. Money markets are now pricing in just 18% chance of a 25 basis point rate cut at March 20, 2024 meeting, down from over 50% chance priced in a week ago. Pricing for a rate cut for May 1, 2024 meeting stands above 70%. Delayed in market pricing for the beginning of Fed rate cut cycle is providing support for the US dollar, with EURUSD dropping to 1.0760 area today - the lowest level since December 12, 2023. This, in turn, puts pressure on gold prices.
Taking a look at GOLD chart at H1 interval, we can see that price broke above the upper limit of the $2,015 - 2,036 trading range last week and managed to reach the textbook target of the breakout in the $2,056 per ounce area. However, bulls failed to extend the advance beyond this area and price started to pull back. Situation is very similar to the one from January 12-15, 2024 (orange circle), which was followed by a quick pullback back into the aforementioned trading range and even beyond it. Having said that, the next support zone to watch on GOLD can be found in the $2,015 area, but a move below it cannot be ruled out if the current sentiment lasts.
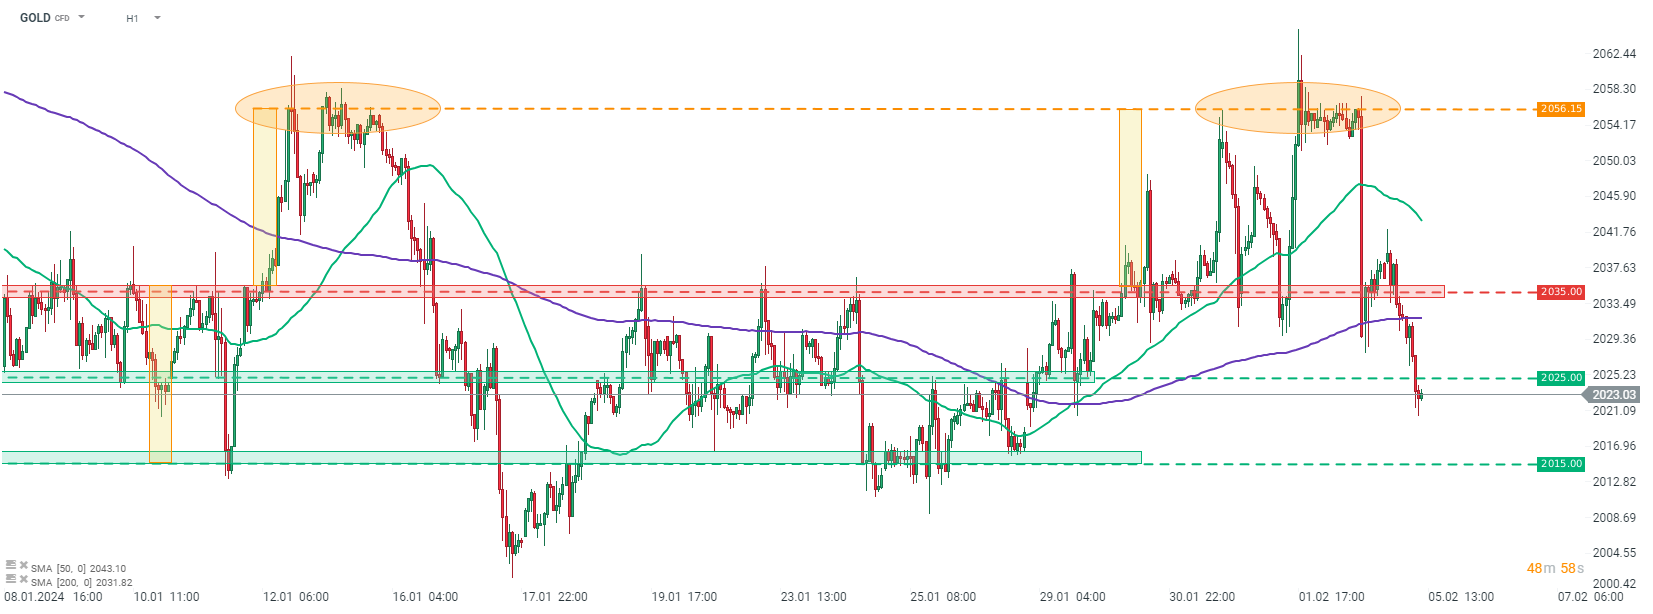
Source: xStation5

โกโก้ปรับตัวขึ้น จากแรงหนุนของอุปสงค์เอเชียที่ฟื้นตัว ขณะที่ยุโรปยังคงชะลอตัว

ทองคำยังยืนเหนือระดับ 4,000 ดอลลาร์ 🚩 แนวโน้มถัดไปของโลหะมีค่าจะเป็นอย่างไร?

Morning Wrap: ตลาดเอเชียปรับตัวลงตามแรงขายหุ้นเซมิคอนดักเตอร์สหรัฐฯ จับตาผลประกอบการ TSMC

Morning Wrap: จับตาทิศทางต่อไปของช่องแคบฮอร์มุซ เงินเฟ้อ และอัตราดอกเบี้ยสหรัฐฯ