
Gold fell to three-month lows on Friday and is on track for the fourth consecutive week of declines as the hawkish Fed sparked a rally in the dollar, which, in turn, spooked investors away from the precious metals. Price broke below the key support zone around $1830 which coincides with 61.8% Fibonacci retracement of the upward wave started at the end of March 2021, 200 SMA (red line), upward trendline and lower limit of the 1:1 structure. If a downward move deepens further, the next support to watch lies at the $1765, where the 78.6% Fibonacci retracement is located. On the other hand, if buyers manage to regain control, then another upward impulse towards resistance at $1900 may be launched.
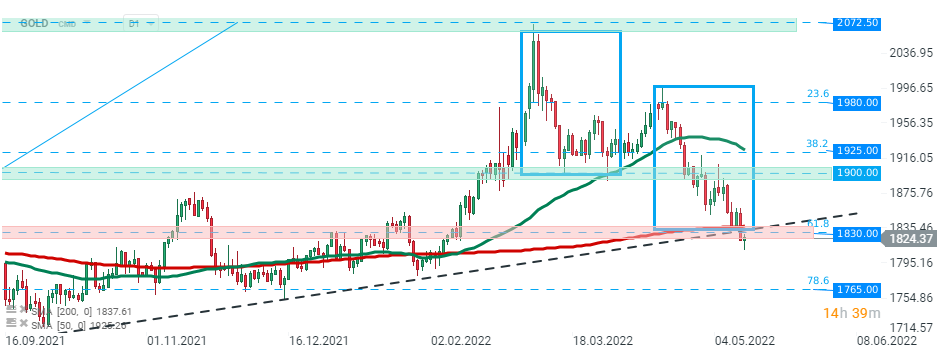
GOLD, D1 interval. Source: xStation5

ราคาน้ำมันอ่อนตัว ขณะที่หุ้นชิปฟื้นแรง หลังตลาดเริ่มปรับตัวรับความตึงเครียดล่าสุด

GOLD - ปรับฐานเพื่อสะสมแรงขึ้นต่อ?

ข่าวเด่นวันนี้ 10 ก.ค.

Chart of the Day 🚩 น้ำมันร่วงจาก 80 ดอลลาร์ ท่ามกลางความตึงเครียดสหรัฐฯ-อิหร่าน ทิศทางต่อไปจะเป็นอย่างไร?