
Gold jumped at the beginning of this week and managed to break above the resistance zone ranging above the $1,830 level. However, volatility faded later on and the precious metal traded in a $1,835-1,845 range following the upside breakout. While it is common for gold to gain at times of market turmoil, the situation looked different recently. Gold has been moving lower during the Asian session and a strong downward impulse was triggered at the start of the European cash trading. Price dropped back below $1,835 and is now testing the aforementioned $1,830 zone as a support. Weakness on the gold market can be blamed at a pick-up in market rates. Increase in US yields is making gold less attractive as an investment and outlook may not improve soon as Fed is expected to tighten policy. Big event for gold traders will come next week on Wednesday, when the FOMC announces its next monetary policy decision at 7:00 pm GMT. No change in the level of rates is expected yet but some guidance on the case is likely to be offered.
Taking a look at GOLD from a technical point of view, we can see that a local head and shoulders pattern was painted on the H1 interval. Neckline of this pattern was broken this morning and one cannot rule out that a deeper downward move is looming. However, a lot will depend on the reaction to the $1,830 support zone.
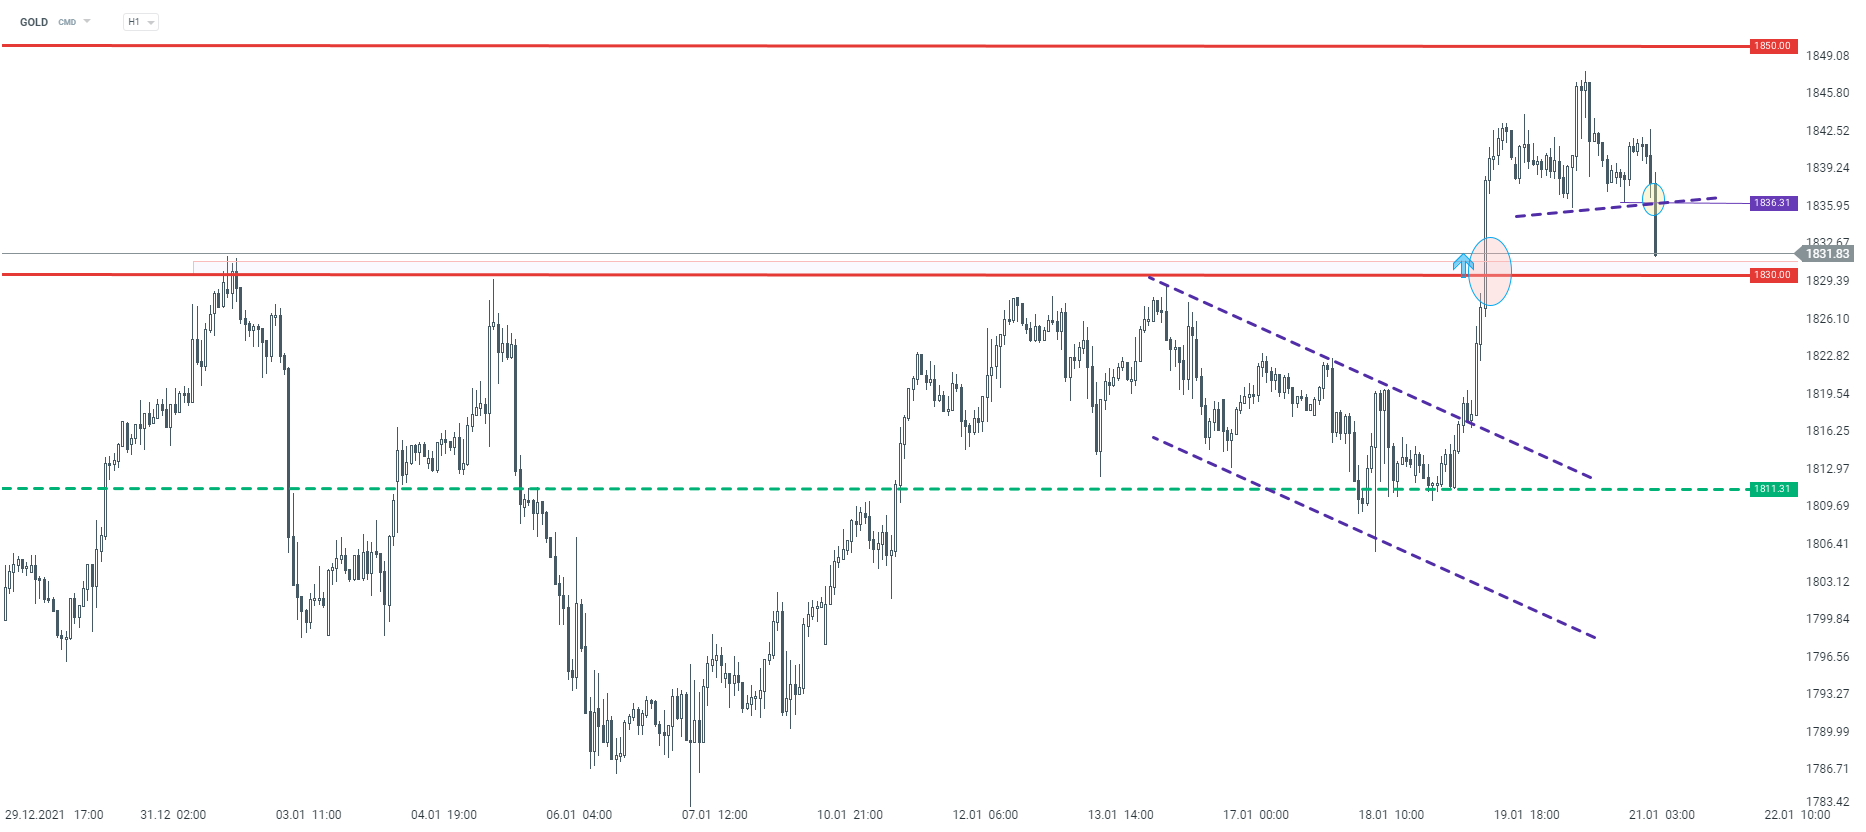 Source: xStation5

3 ตลาดที่ต้องจับตาในสัปดาห์

Wall Street ฟื้นตัว ขณะที่ตลาดจับตาการแทรกแซงค่าเงินเยนอีกครั้ง?

ปฏิทินเศรษฐกิจ: จับตาเงินเฟ้อยุโรป และงบยักษ์ใหญ่น้ำมัน
AI หนุนการฟื้นตัว หุ้นเทคฯ กลับมาแข็งแกร่ง