
Oil is on the move today. Crude gaining overnight, allowing Brent (OIL) to test the $80 per barrel mark - the highest level since October 2018. Elsewhere, WTI (OIL.WTI) managed to jump above the $76 per barrel and reached the highest level since early-July 2021. Oil gains as demand rises and energy inventories decline. It is said that the scale of easing OPEC+ output curbs is not enough to offset pick-up in demand. However, longer-dated futures continue to trade near $70 per barrel suggesting that the market expects a short-term disruption in balance. Goldman Sachs expects Brent to reach $90 per barrel by the end of the year. Trafigura, one of the largest commodities traders in the world, expects both Brent and WTI to continue to climb in the coming weeks.
A look at the OIL chart at the H1 interval shows us that the price managed to climb and test the $80 area but was unable to break above it. A pullback can be spotted and the long, upper wick of the previous hourly candlestick hints that it may continue. In such a scenario, the level to watch is $77.15 per barrel and is marked with the lower limit of local market geometry.
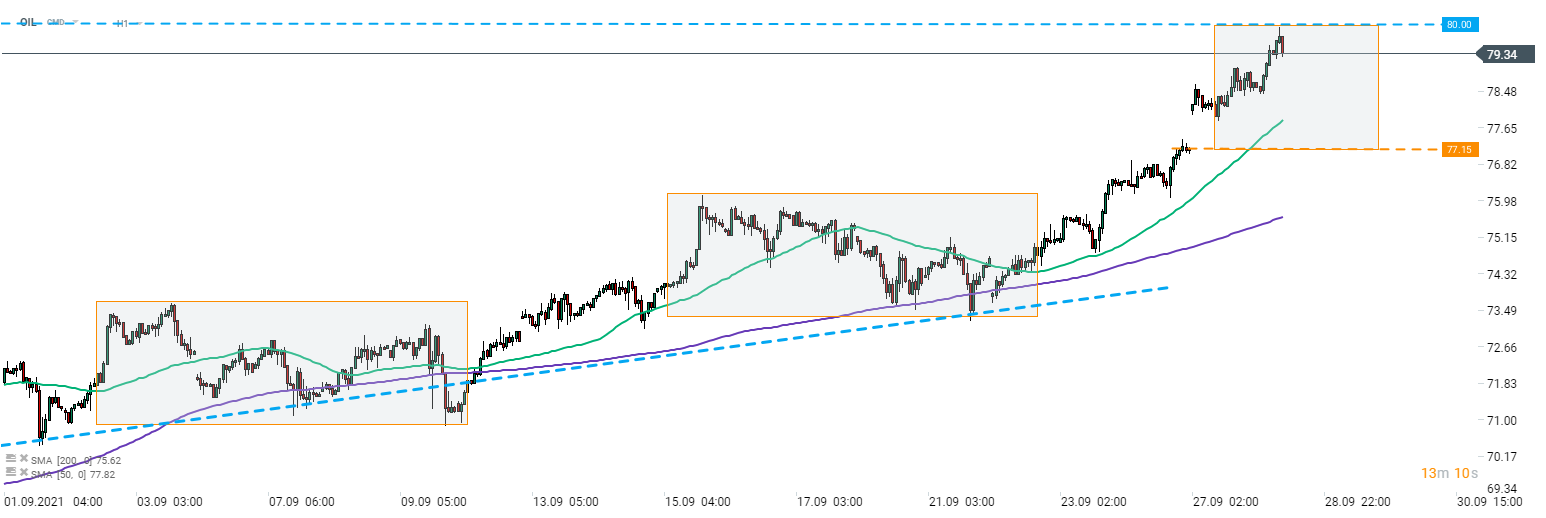 Source: xStation5

GOLD - ความระมัดระวังปกคลุมตลาดก่อนการประชุม Fed

Morning Wrap: ตลาดเอเชียเผชิญแรงขายจากผลประกอบการ SK Hynix และความตึงเครียดอิหร่าน ดอลลาร์หยุดชะลอความเคลื่อนไหวก่อนผลประชุม Fed

ตลาดกาแฟเผชิญแรงกดดันจากสภาพอากาศและคลังสินค้าที่ลดลง: ความย้อนแย้งของผลผลิตบราซิลที่ทำสถิติสูงสุด

Chart of the Day: ราคาน้ำมันร่วง...ใครได้รับผลกระทบมากที่สุด?