
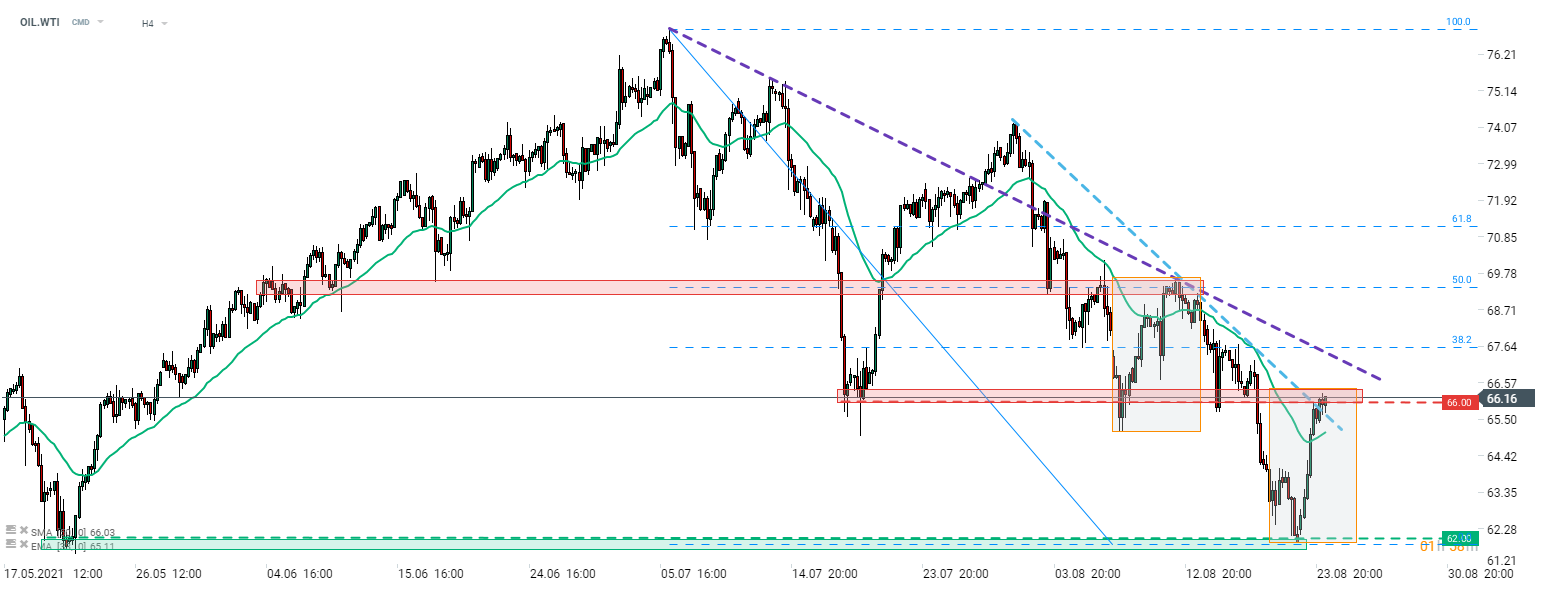
Equity and commodity markets rallied amid broad risk-on moods. Oil was one of the top gainers with Brent and WTI gaining over 5%. That was a major reversal following a month of weakness in oil prices. Taking a look at the OIL.WTI chart, we can see that the price has reached a resistance zone at $66.00. One of the short-term downward trendlines can be found in the same area as well as the upper limit of a local market geometry. Break above this zone would pave the way for the test of the second trendline, currently near 38.2% retracement of recent correction ($67.60 area). Should the upward move continue, the major resistance is marked with a recent local high at 50% retracement ($69.50) and break above this zone would hint at short-term trend reversal
 Source: xStation5

GOLD - ความระมัดระวังปกคลุมตลาดก่อนการประชุม Fed

Morning Wrap: ตลาดเอเชียเผชิญแรงขายจากผลประกอบการ SK Hynix และความตึงเครียดอิหร่าน ดอลลาร์หยุดชะลอความเคลื่อนไหวก่อนผลประชุม Fed

ตลาดกาแฟเผชิญแรงกดดันจากสภาพอากาศและคลังสินค้าที่ลดลง: ความย้อนแย้งของผลผลิตบราซิลที่ทำสถิติสูงสุด

Chart of the Day: ราคาน้ำมันร่วง...ใครได้รับผลกระทบมากที่สุด?