
Stock traders launched a new week in upbeat moods with indices from Asia-Pacific finishing today's trading higher and European benchmarks advancing as well. US index futures also trade higher with Russell 2000 (US2000) leading with 0.7% gain and Nasdaq-100 (US100) lagging behind others with 0.3% gain. The week ahead is slightly lighter in terms of data and macro events than previous ones but traders will be nevertheless offered some interesting reports. US retail sales data for April tomorrow at 1:30 pm BST as well as Powell's speech on monetary policy on Friday, 4:00 pm BST are top events to watch in US macro calendar for the week. US tech shares may see some moves later into the week when Alibaba Group reports earnings on Thursday.
Taking a look at US100 chart at H1 interval, we can see that the index managed to halt recent declines at 13,330 pts support zone, marked with 23.6% retracement of the upward move launched in late-April, lower limit of the market geometry as well as the upward trendline. Bouncing off this area confirmed the bullish sentiment and index started to recover recent losses. A break above 50-hour moving average (green line) was delivered today and now the way for a test of recent highs just shy of 13,500 pts mark is open.
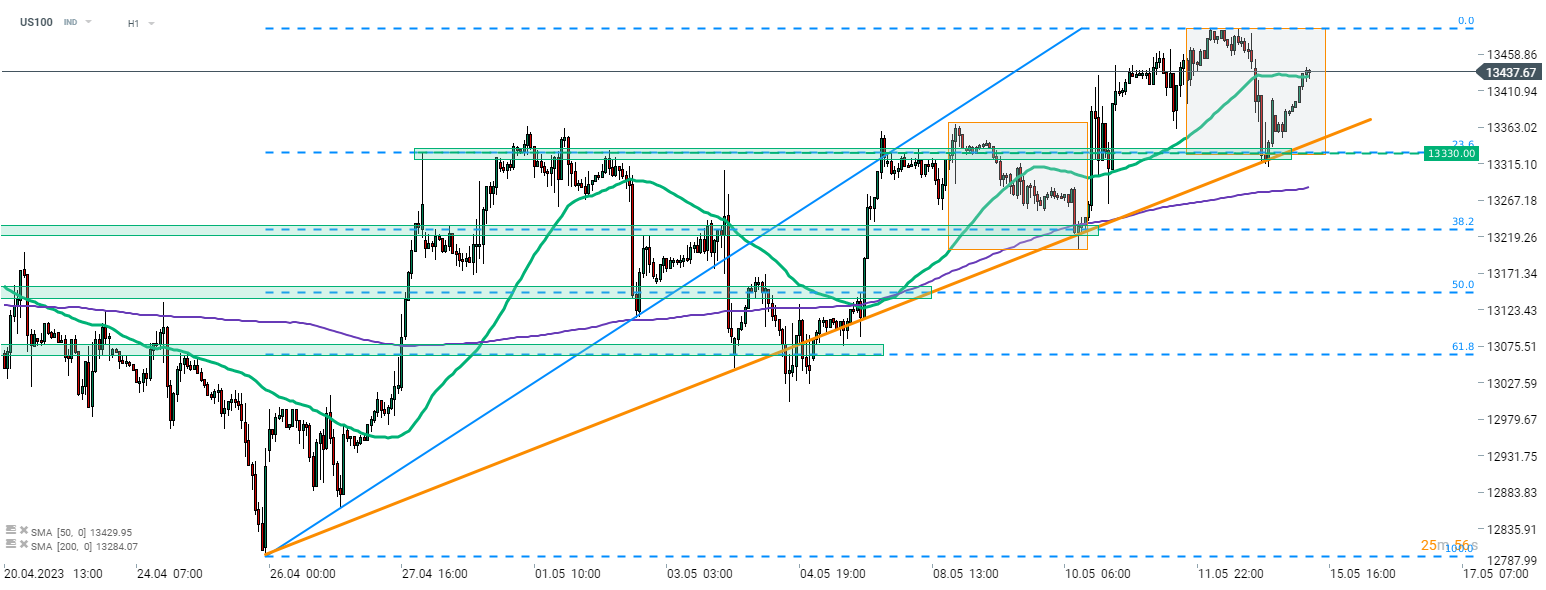 Source: xStation5

ข่าวเด่นวันนี้ 15 ก.ค.

ดอลลาร์ร่วง หลังราคาสินค้าในสหรัฐฯ ลดลงครั้งแรกในรอบ 6 ปี

สรุปตลาด: หุ้นยุโรปร่วง หลังวิกฤตช่องแคบฮอร์มุซทวีความตึงเครียด ตลาดจับตา CPI สหรัฐฯ

นักลงทุนสถาบันมองอย่างไร? ความเชื่อมั่นจาก BofA FMS พุ่งสูงสุดในรอบหลายเดือนนับตั้งแต่กุมภาพันธ์