
This week will see a lot of interesting releases, especially the second half of it. Traders will be offered Q1 GDP data from the United States and Germany as well as Bank of Japan decision and flash CPI data for April from Europe. Stock traders will also have a lot of information to digest as Wall Street earnings season is in full swing. Tech-heavy Nasdaq-100 (US100) may be on the move this week as 4 US mega-tech companies are scheduled to release earnings:
- Alphabet (GOOGL.US) - Tuesday, after market close
- Microsoft (MSFT.US) - Tuesday, after market close
- Meta Platforms (META.US) - Wednesday, after market close
- Amazon (AMZN.US) - Thursday, after market close
Taking a look at US100 chart at H1 interval, we can see that the index has been trading in a triangle pattern for some time with a 13,000 pts area serving as the lower limit of the pattern. This is a continuation pattern so traders should be aware of a potential for a downside breakout, especially as price has reached a lower limit recently. In case of a break below 13,000 pts, textbook range of breakout from the pattern suggests possibility of an around 350-points drop, to 12,650 pts area.
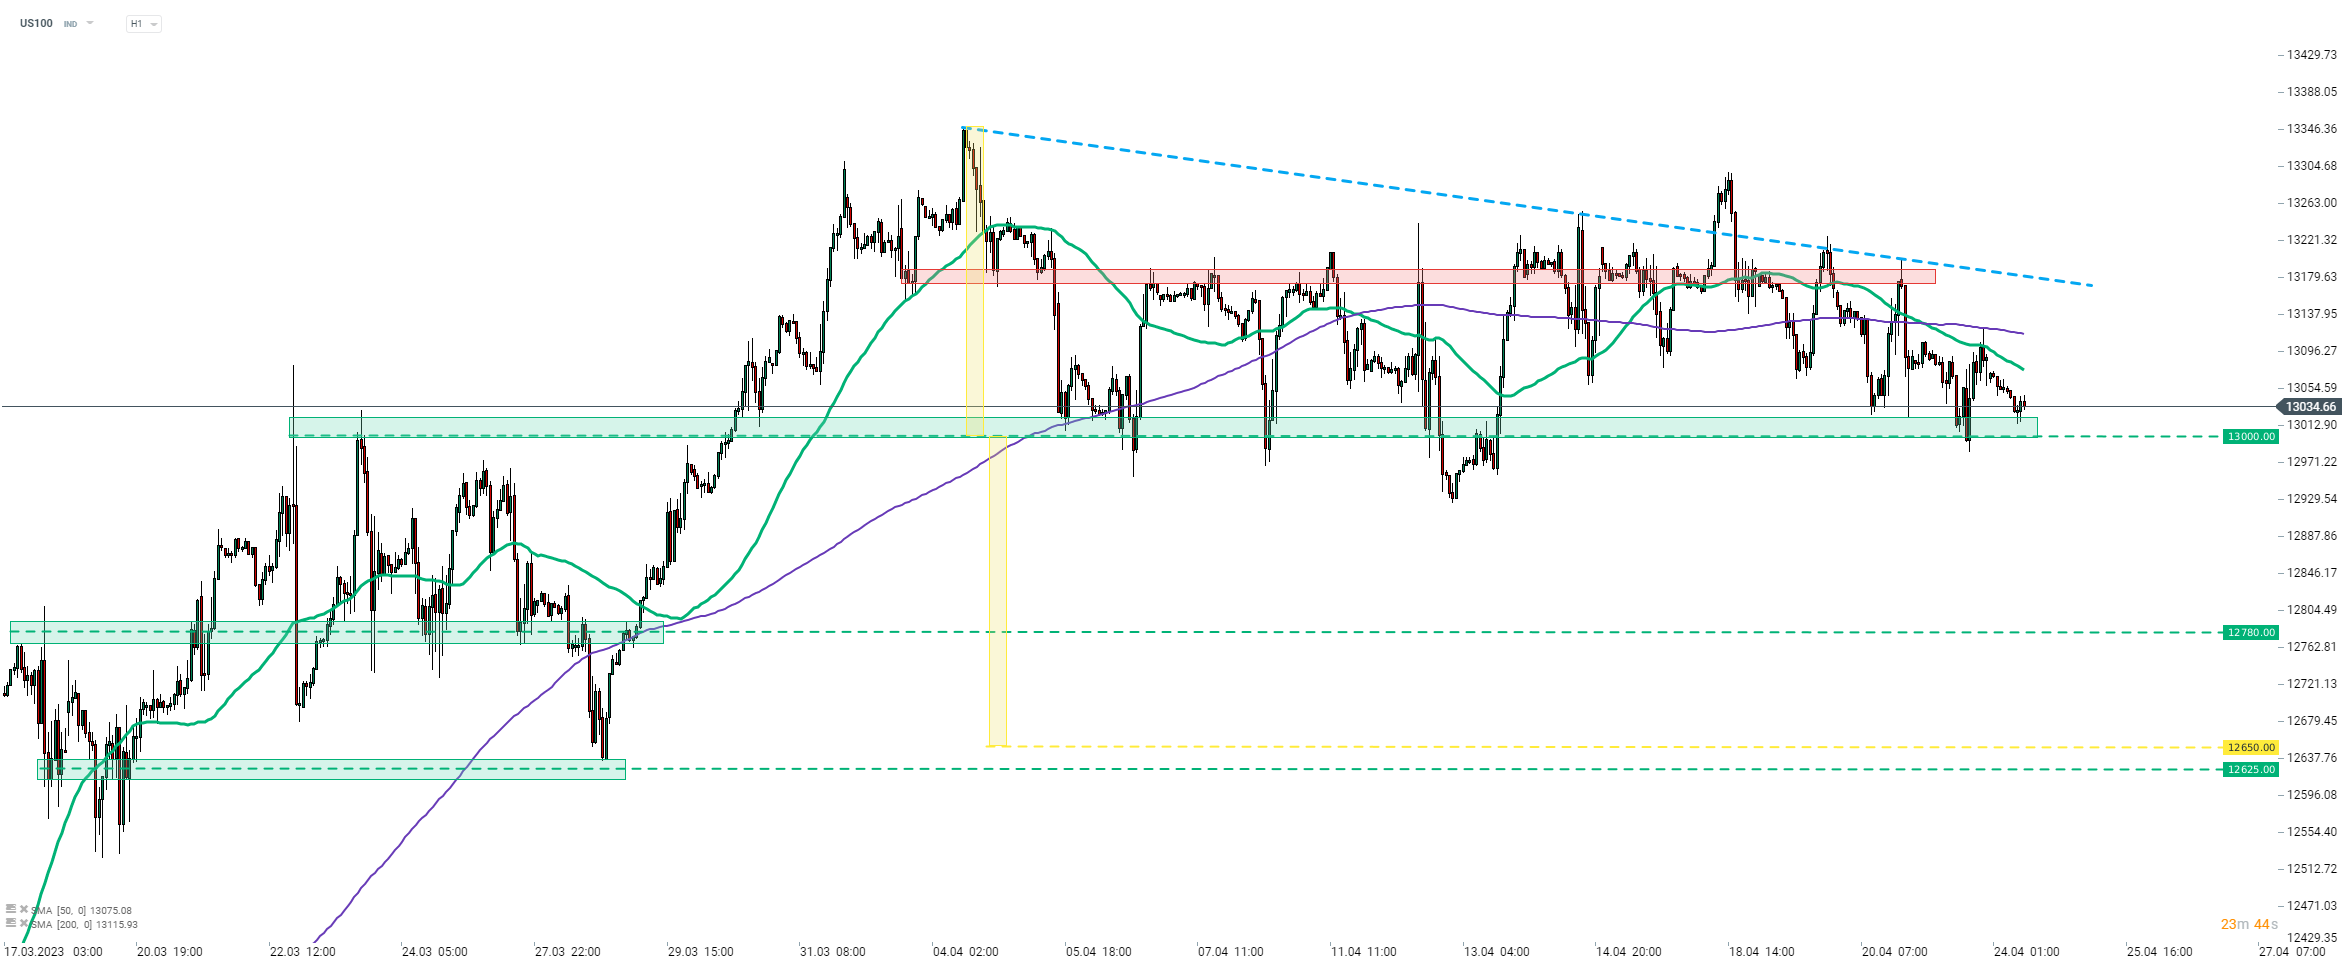
Source: xStation5

ตลาดเด่นรายวัน 🔼 Nasdaq พุ่ง 1.2% หลังหุ้นกลุ่มเซมิคอนดักเตอร์ฟื้นตัว

Morning Wrap: ตลาดหุ้นลุ้นรีบาวด์ ท่ามกลางความขัดแย้งสหรัฐฯ-อิหร่าน

DeepSeek Moment ครั้งใหม่กำลังมา? Moonshot AI ท้าทายยักษ์ใหญ่ในวงการ AI

BREAKING: PPI เยอรมนีชะลอตัว แรงกดดันด้านราคาเริ่มคลี่คลาย