
Today could be significant both for the shaping of the FED's future monetary policy and the direction of the main Wall Street indices, US100 and US500. The July reading will likely be the first in exactly a year when inflation was higher year-on-year compared to the previous month. According to the consensus, CPI inflation is expected to be 3.3% Y/Y, while in June it was 3.0% Y/Y. So far, the main indices have responded positively to lower readings, resulting in increases in US500 and US100 and a weakening dollar. However, today, a reverse reaction is possible, and everything will depend on the readings.
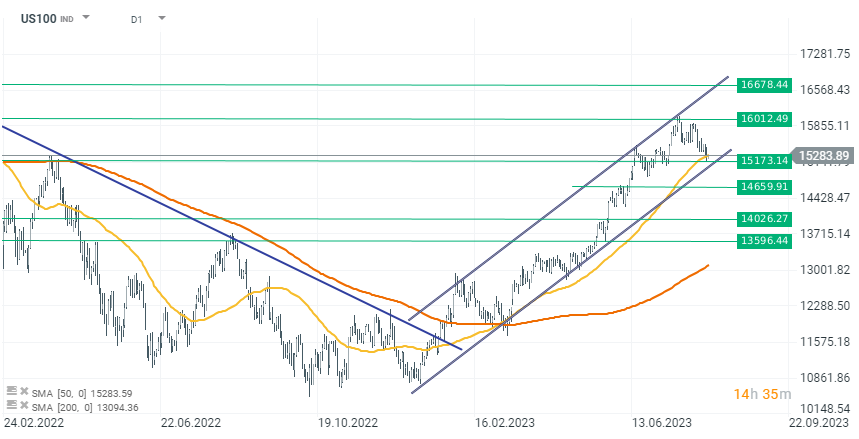 On US500 and US100, we observe an interesting situation. Both instruments are trading close to the lower limit of the upward channel, which has been respected since the beginning of March 2023. Therefore, if today's data falls below expectations, it may cause a rebound in the indices and euphoria in stocks driven by lowering inflation. Otherwise, the market may react with declines and break through the key support line.
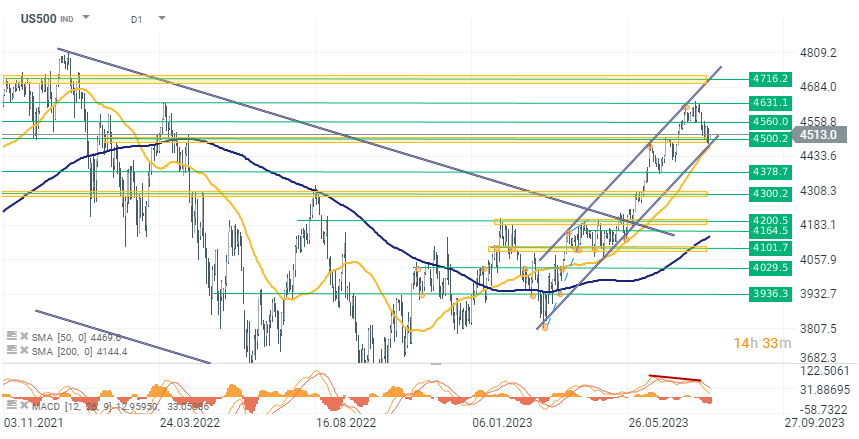 US500, the index is trading 0.50% higher today around 4513. The index price is slightly above the key support line at the 4500 point level (marked on the chart in a green-yellow zone). Additionally, the lower limit of the upward trend converges at the same level, which may create an exceptionally strong support zone.

🔼 DE40 รับแรงหนุนจากผลประกอบการของ SAP

Economic Calendar: ภาคอุตสาหกรรมเผชิญแรงกดดันจากราคาน้ำมัน

Morning Wrap: ตลาดจะฟื้นตัวหลังแรงเทขายเมื่อวันพฤหัสบดีหรือไม่❓

ข่าวเด่นวันนี้ 24 ก.ค.