
Stock market indices continue to recover from a recent steep sell-off. Once a buy-the-dip behaviour can be spotted. Investors hope that it was just a brief correction and the market will resume upward move. Will bulls manage to regain control in spite of concerns over normalization of the monetary policy?
Taking a look at US500, we can see that the downward move was once again halted at the key 4,340 pts support. This area was tested last week and is marked with the lower limit of the Overbalance structure. Moreover, 100-period EMA runs in the same area. The support looks to have been defended and an upward impulse may be generated now. The nearest resistance to watch is the upper limit of the downward channel. On the other hand, if US500 resumes decline, the next important support to look out can be found at 4,244 pts, where the 23.6% retracement of the multi-month upward move can be found.
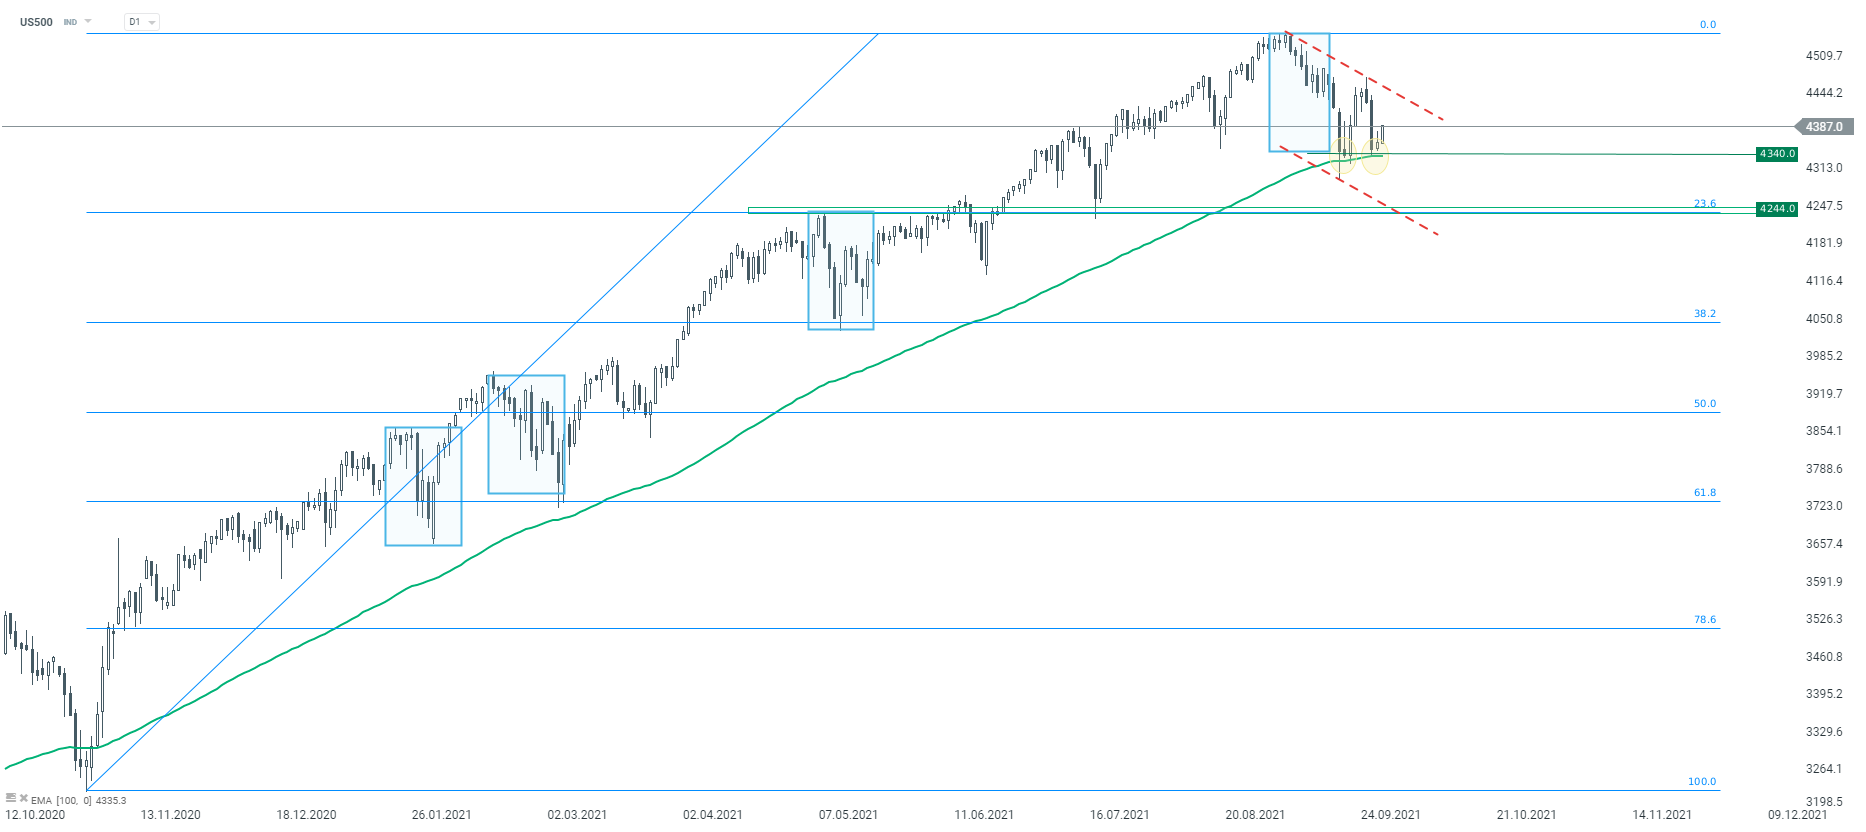 Source: xStation5

ปฏิทินเศรษฐกิจ: จับตาเงินเฟ้อยุโรป และงบยักษ์ใหญ่น้ำมัน
AI หนุนการฟื้นตัว หุ้นเทคฯ กลับมาแข็งแกร่ง

Daily Summary: หุ้นพุ่งรับ Fed ไม่ Hawkish อย่างที่คาด AI Trade กลับมาเด่น เยนแข็งค่า น้ำมันอ่อนตัว

Nasdaq futures พุ่งแรงกว่า 3% 🚀