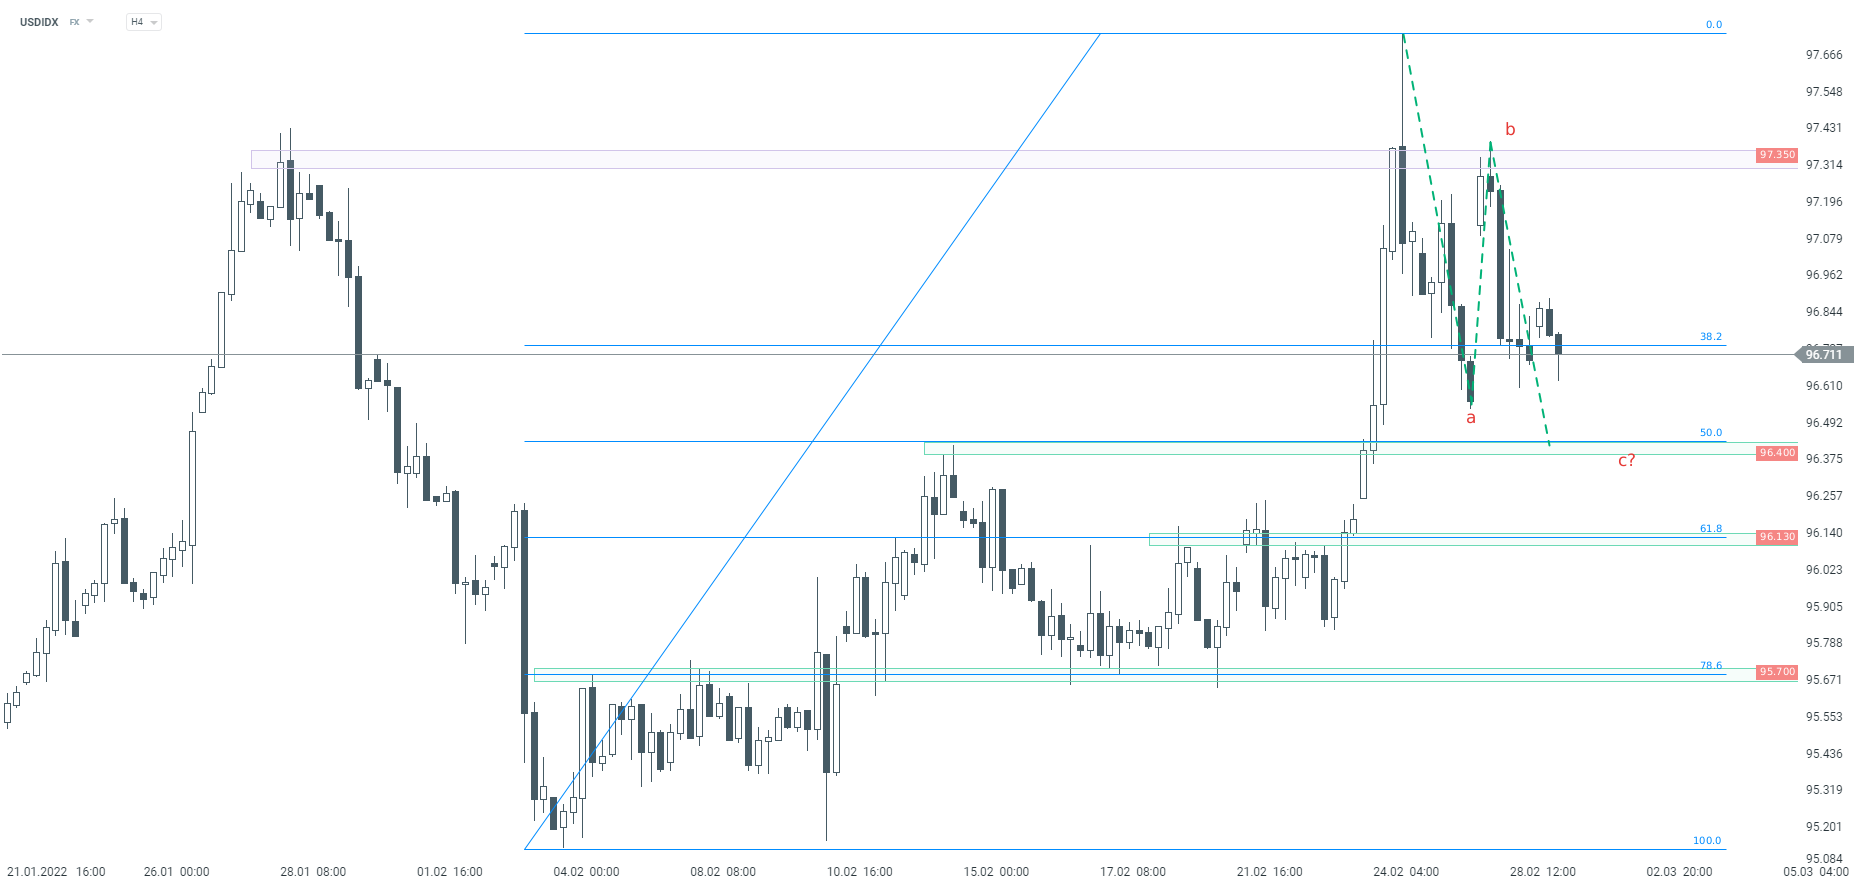
Launch of Russian invasion of Ukraine and accompanying pick-up in geopolitical tensions triggered a flight to safety last week. Those flows have slowed somewhat but assets like gold or US dollar continue to trade above pre-invasion levels. Taking a look at the US dollar index chart (USDIDX), we can see that the price spiked to 97.70 last week when the Russian invasion began but has given back part of gains later on. Subsequent pullback starts to look like an ABC correction and if the third leg of this pattern is executed in a textbook manner, USDIDX could drop to the 96.40 support area, which is marked with a 50% retracement of the upward impulse started at the beginning of February. However, before that happens, price needs to break below the 38.2% retracement that is being tested at press time (96.70).
 Source: xStation5

ข่าวเด่นวันนี้ 30 ก.ค.

Warsh ไม่ได้ส่งสัญญาณ Hawkish ชัดเจน ตลาดมอง Dovish มากขึ้น EUR/USD แตะ 1.1450
BREAKING: Fed คงดอกเบี้ย ท่ามกลางความเห็นต่างภายใน และการชะลอจุดยืนของ Warsh

Chart of the Day: เงินเฟ้อกดดัน AUDUSD! 'เหยี่ยว' RBA กำลังเปลี่ยนท่าที?