
The beginning of this week (and the new month) is being marked by USD weakness against the major currencies.
However, the EUR/USD pair continues to struggle to break above the Fibonacci levels as we will see below.
4-hour time frame chart.
On the 4-hour chart, we can see that buyers are still struggling to break above the Fibonacci levels marked by 61.8% which coincides with the upper limit of the range.
Although the medium and long term trend is bearish, in the short term it seems that evidence is starting to emerge that a bullish recovery of the euro against the US dollar could emerge.

EUR/USD, 4 hour time frame chart. Source: xStation
In the dollar index, we can see that sellers are regaining control of the price after the breakout of the downtrend line has emerged.
This scenario ends up supporting the possibility of the euro recovering against the dollar.

Dollar INDEX, Daily Time frame chart. Source: xStation 5
During this session, JPY is leading the gains!
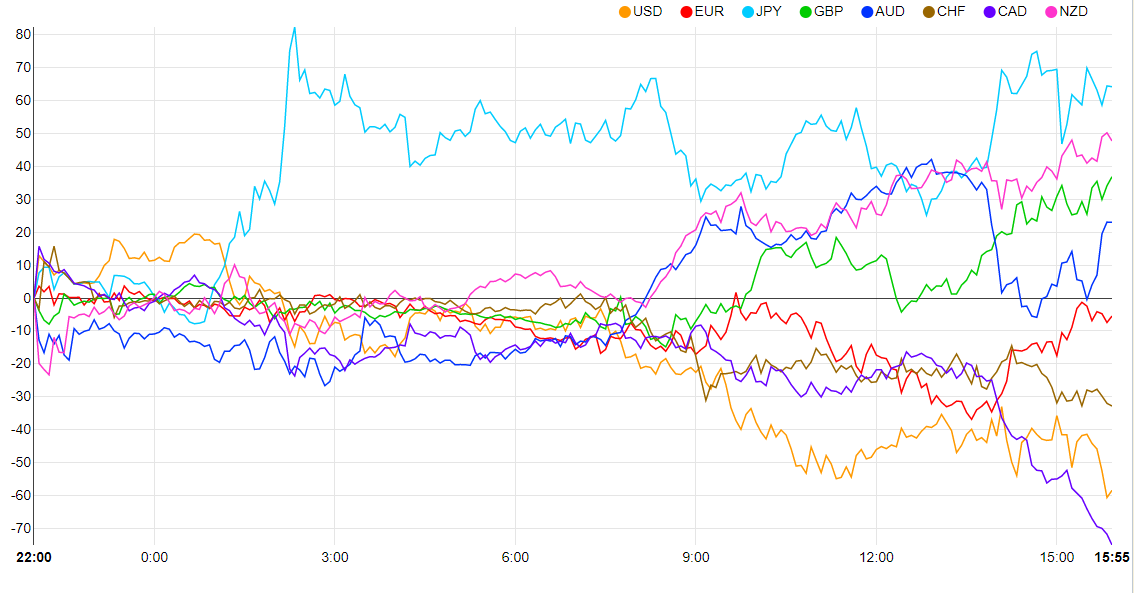
Source: currency-strength.com
Henrique Tomé, XTB Portugal

🔴Live: ทองจะร่วงต่อ หรือกลับ $4,200?

ข่าวเด่นวันนี้ 27 ก.ค.

3 ตลาดที่น่าจับตาในสัปดาห์นี้

GOLD: แรงกดดันฝั่งขายกลับมา ทดสอบแนวรับสำคัญบริเวณ $3,960