
The start of Monday's session was marked by risk-off sentiment, however, market sentiment improved during the European session.
Daily Time Frame Chart
On the D1 chart, we can see that the price has reached an important support level(red rectangle) that coincides with the lower boundary of the channel.
This zone could provide some space for a new recovery, as long as the price stays above the structure.
This morning's sell-off reflects the importance of this structure and as long as the price remains above the lower boundary of the channel, we can expect a new bullish movement.

EUR/USD, Daily time frame chart. Source: xStation 5

USD Index. Monthly Time Frame Chart. Source: xStation 5
On the other hand, when we look at the dollar index chart, we can see that there is still room for further bull run, according to the technical target of the range that was previously broken.
Besides the dip, GBP is leading the gains at this moment.
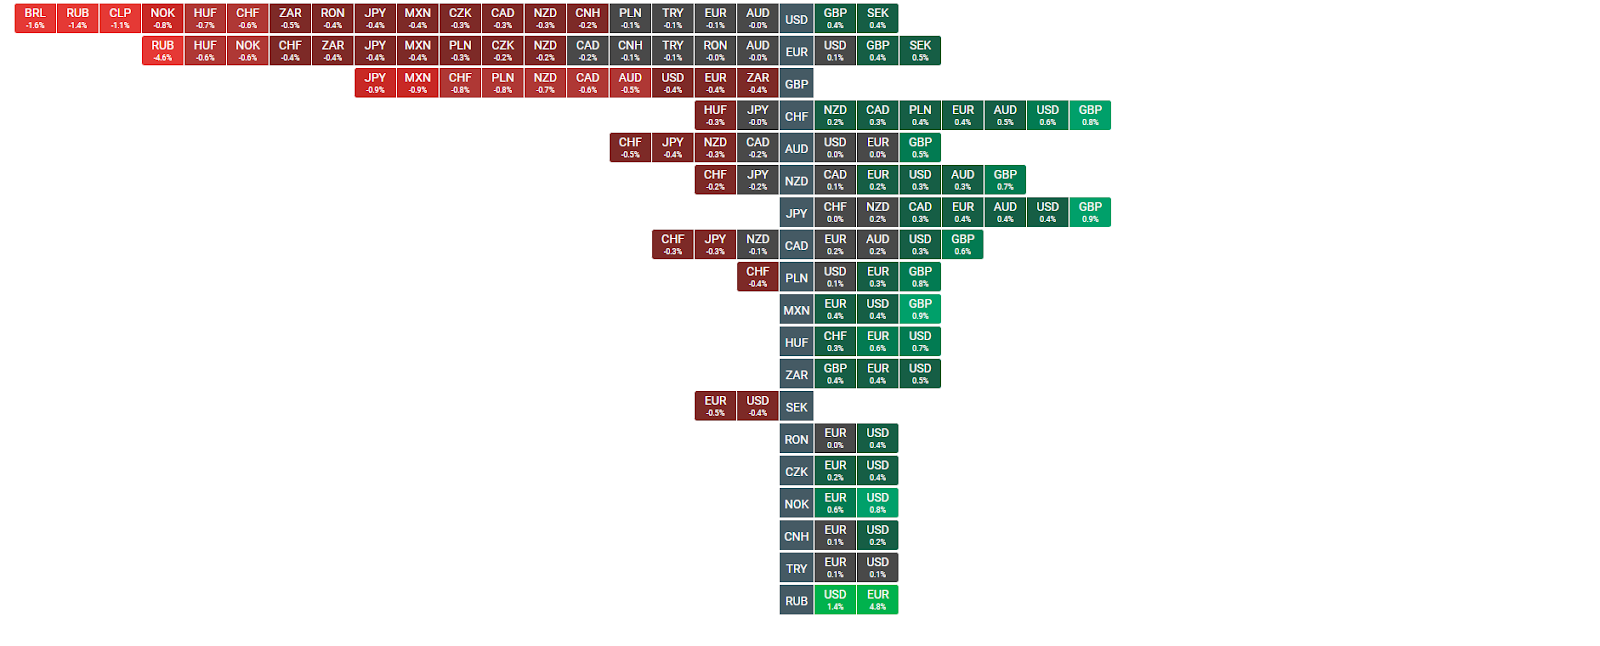
Heatmap. Source: xStation 5
Henrique Tomé, XTB Portugal

สัปดาห์ข้างหน้า: ราคาน้ำมันพุ่งขึ้น ขณะที่ตลาดหุ้นเผชิญบททดสอบจากผลประกอบการ

ตลาดเด่นรายวัน: ดอลลาร์ชนะอีกยก แต่โตเกียวกำลังเตรียมรับมือ

BREAKING: PPI เยอรมนีชะลอตัว แรงกดดันด้านราคาเริ่มคลี่คลาย

Economic Calendar: จับตาเงินเฟ้อเยอรมนี-แคนาดา พร้อมชุดข้อมูลเศรษฐกิจโปแลนด์