
The EUR/USD pair has been under pressure over the past few weeks; however, last Friday, bulls showed signs of strength once again.
EUR/USD - 4 hours time frame chart
However, on the 4-hour chart, we can see that buyers regained control of the price near an important support zone marked by 1.0757. Currently, the price is approaching a significant obstacle - the downtrend line. If buyers manage to break above this zone, the upward movement may resume.
 EUR/USD, 4 hours time frame chart. Source: xStation 5
USD INDEX
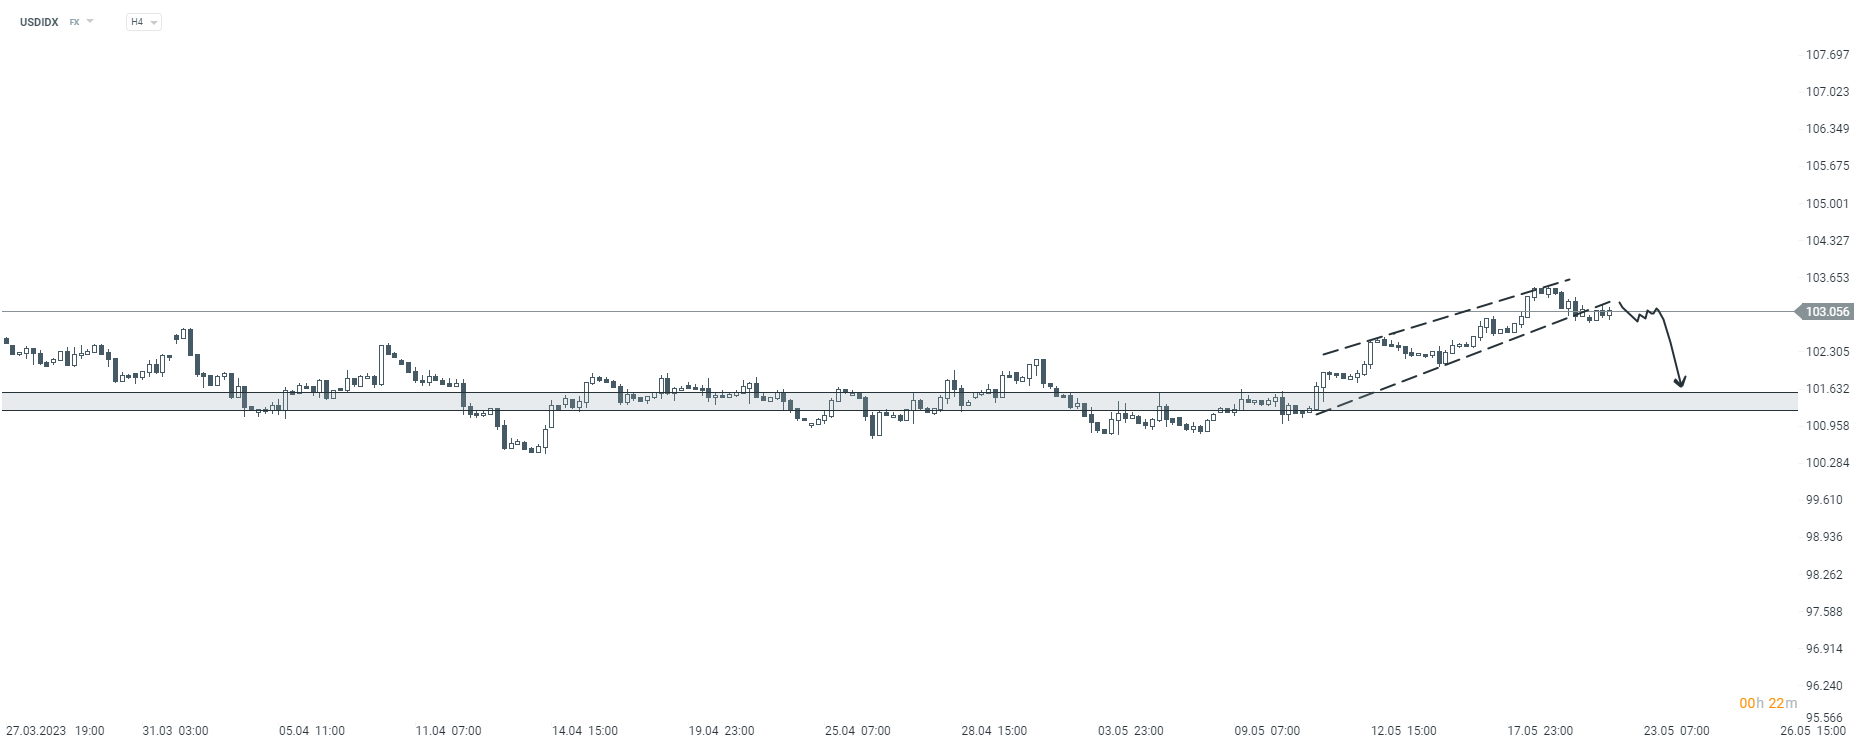
On the 4 hours time chart of the US Dollar Index, we can also see signs that the bearish scenario for the USD may indeed manifest. From a technical standpoint, we observe that sellers managed to break below the lower boundary of the rising wedge pattern, which could bring new selling pressures to the price.
Henrique Tomé,
XTB Portugal

สัปดาห์ข้างหน้า: ราคาน้ำมันพุ่งขึ้น ขณะที่ตลาดหุ้นเผชิญบททดสอบจากผลประกอบการ

ตลาดเด่นรายวัน: ดอลลาร์ชนะอีกยก แต่โตเกียวกำลังเตรียมรับมือ

BREAKING: PPI เยอรมนีชะลอตัว แรงกดดันด้านราคาเริ่มคลี่คลาย

Economic Calendar: จับตาเงินเฟ้อเยอรมนี-แคนาดา พร้อมชุดข้อมูลเศรษฐกิจโปแลนด์