
Heightened risk aversion anbe spotted across multiple markets recently. The market jitters revolved around rising inflation, highly anticipated US Fed monetary policy meeting later this week and growing tensions between the US and Russia over Ukraine. After talks between Russia and NATO members failed to lower tension, imminent military activity at the Russia-Ukraine border led the US and the UK to remove embassy staff from Kyiv. At the same time, investors monitor the possible implementation of sanctions imposed on Russia and its repercussions with EU trade, particularly for energy. Meanwhile the Fed is expected to confirm a rate hike in March and a balance-sheet reduction later this year although the size of the rate hike is still uncertain. Let's look at the technical situation of three popular markets: US100, Bitcoin and VOLX
When it comes to US indices, the technological Nasdaq (US100) is the worst performer. Technically looking at the D1 interval, the sell-off accelerated after the index broke below the psychological support at 15,000 pts which is marked with lower limit of the 1: 1 structure (red rectangle), which was the largest correction in the last bullish wave from March 2020. According to the Overbalance methodology, breaking below this level often heralds further declines or even a change in the prevailing trend. Currently, investors should focus their attention on the support at 13,650 pts, which is equal to the downward correction from the beginning of 2020 - when the pandemic hit the markets.
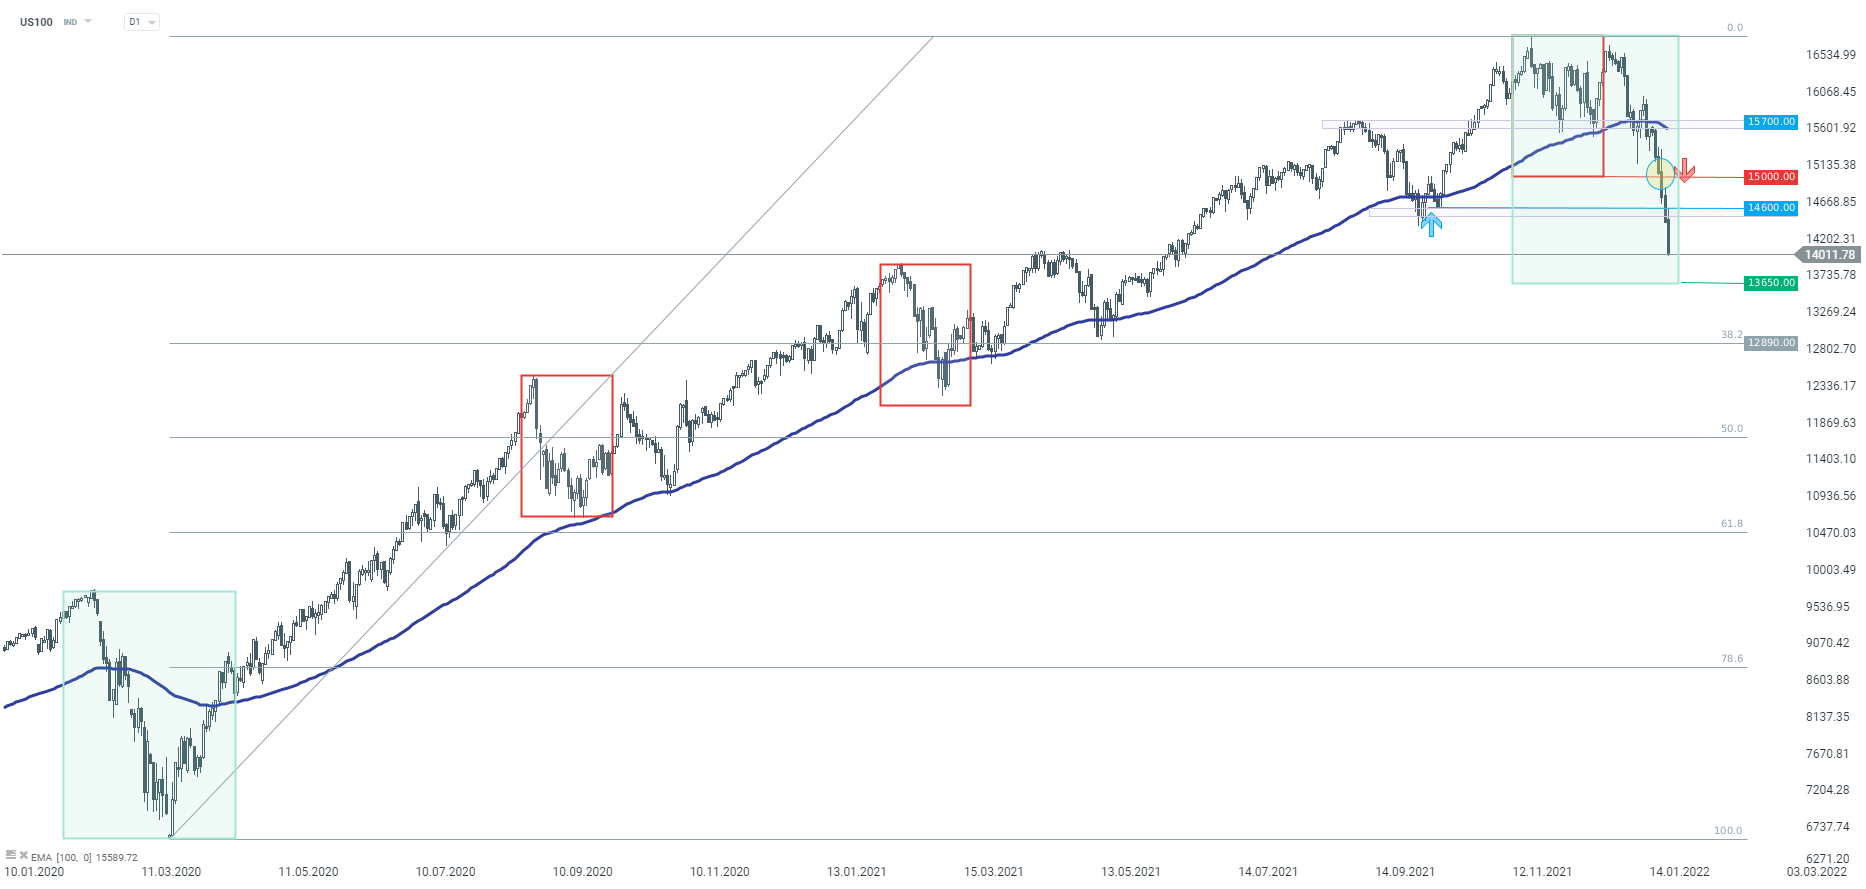 US100, D1 interval. Source: xStation5
The cryptocurrency market is also performing terribly in recent days. Bitcoin price fell 50% from its all highs from November 2021. Looking at the Bitcoin chart, the classic head and shoulders pattern formed on the D1 interval. Although it does not seem realistic at the moment, the model range of potential declines for this type of structure is located around 15,000. USD. Before that, sellers will need to break below major support at the $ 30,000.
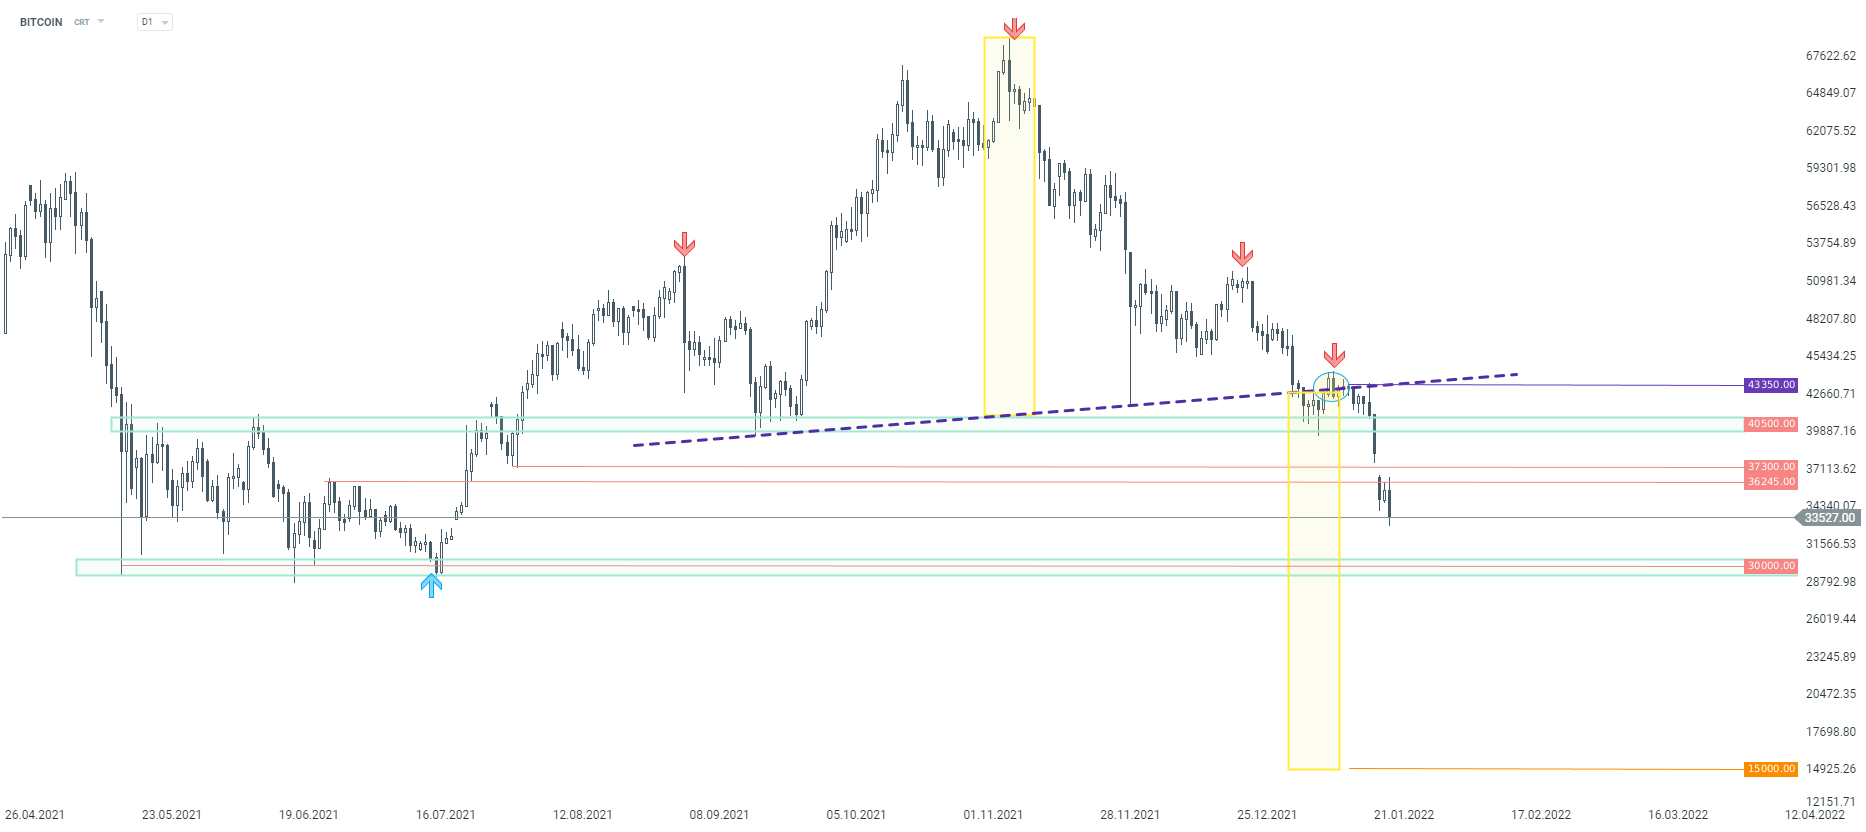 BITCOIN, D1 interval. Source: xStation5
VIX Index (VOLX), commonly known as the fear index, measures expected volatility in the US stock market. For several sessions, VOLX has been recording systematic increases, which may indicate that even greater movements on the market could occur in the future. Looking at the D1 chart, the index hit a potential resistance level at 31.5, which is marked with December high and previous price reactions. Should break higher occur, upward move may accelerate which could cause increased volatility in the stock market.
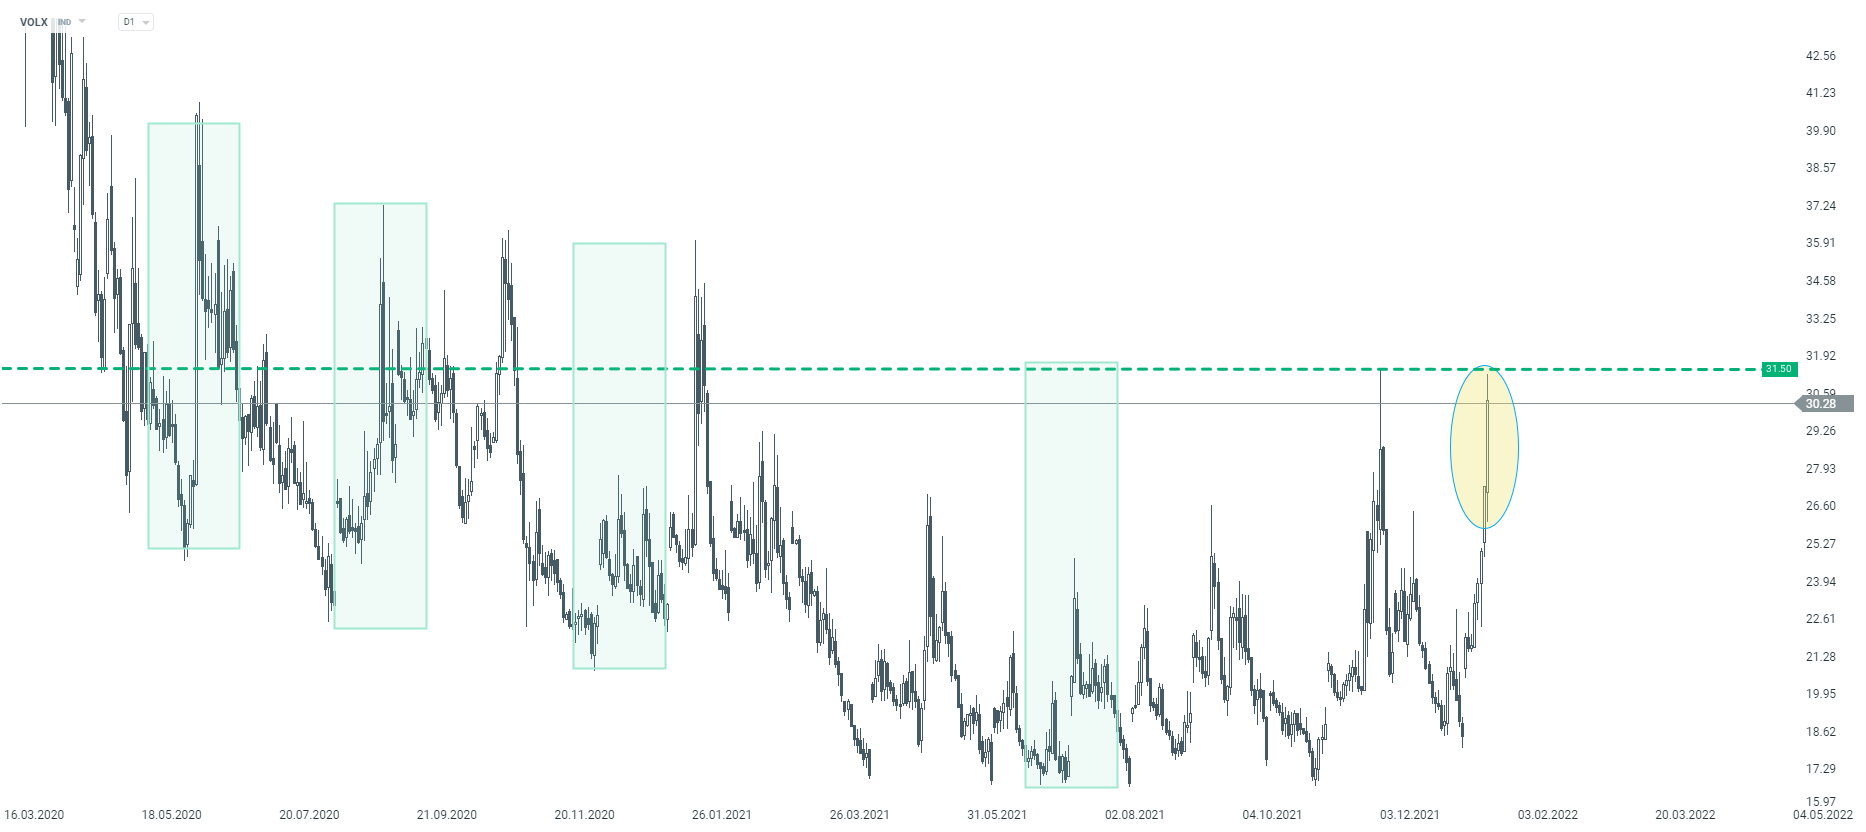 VOLX, D1 interval. Source: xStation5

🔼 DE40 รับแรงหนุนจากผลประกอบการของ SAP

Economic Calendar: ภาคอุตสาหกรรมเผชิญแรงกดดันจากราคาน้ำมัน

Morning Wrap: ตลาดจะฟื้นตัวหลังแรงเทขายเมื่อวันพฤหัสบดีหรือไม่❓

ข่าวเด่นวันนี้ 24 ก.ค.