
Recently, we can observe mixed sentiment in the US stock market. Let's take a look at the technical situation on the US2000. Looking at the H4 interval, we can distinguish two key zones. The resistance is located at 2252 pts, while the major support lies at 2195 pts, and only breaking any of these levels can trigger a bigger move. As for the Overbalance methodology, it still favors buyers - index has recently bounced off the lower limit of the 1: 1 structure and then reached new local high. In the case of the bullish scenario, the next resistance is located around 2,293 pts and is marked with the 78.6% Fibonacci retracement of the last downward wave.
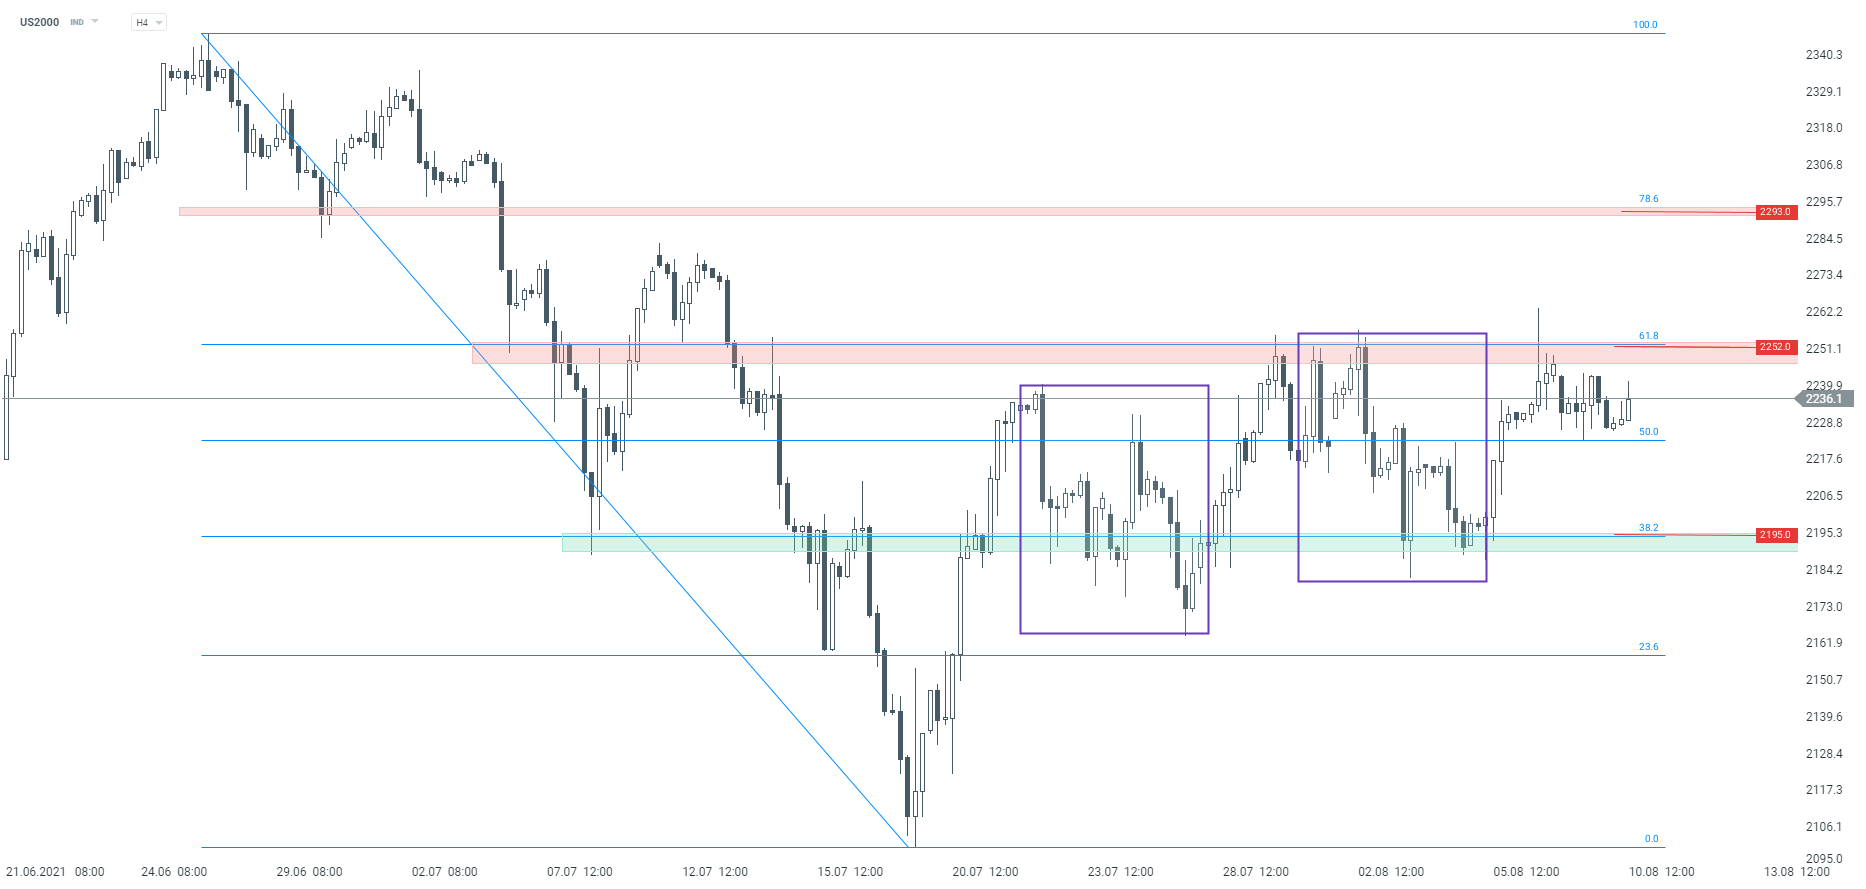 US2000 interval H4. Source: xStation5

ปฏิทินเศรษฐกิจ: จับตาเงินเฟ้อยุโรป และงบยักษ์ใหญ่น้ำมัน
AI หนุนการฟื้นตัว หุ้นเทคฯ กลับมาแข็งแกร่ง

Daily Summary: หุ้นพุ่งรับ Fed ไม่ Hawkish อย่างที่คาด AI Trade กลับมาเด่น เยนแข็งค่า น้ำมันอ่อนตัว

Nasdaq futures พุ่งแรงกว่า 3% 🚀