
Traders are waiting for the FOMC minutes scheduled for this evening (7:00 pm BST). Volatility is expected to be elevated as investors hope for some details on taper discussion.t US indices including US30, EURUSD and DE30 are among markets that may experience bigger moves today’s evening.
US30
Let’s start today’s analysis with the Dow Jones Industrial Average Index - US30 on xStation platform. Looking at the H4 interval, one can see that yesterday's downward correction stopped at the key support near 35,055 pts, which is a result of previous price reactions, 23.6% Fibonacci retracement, as well as lower limit of local 1:1 structure.Should buyers manage to hold the price above it, an upward move may be resumed and reach new all time highs. On the other hand, if the price breaks below 35,055 pts, downward correction may deepen. In such a scenario, the key next support to watch can be found at 34,600 pts, where the 50% Fibonacci retracement can be found.
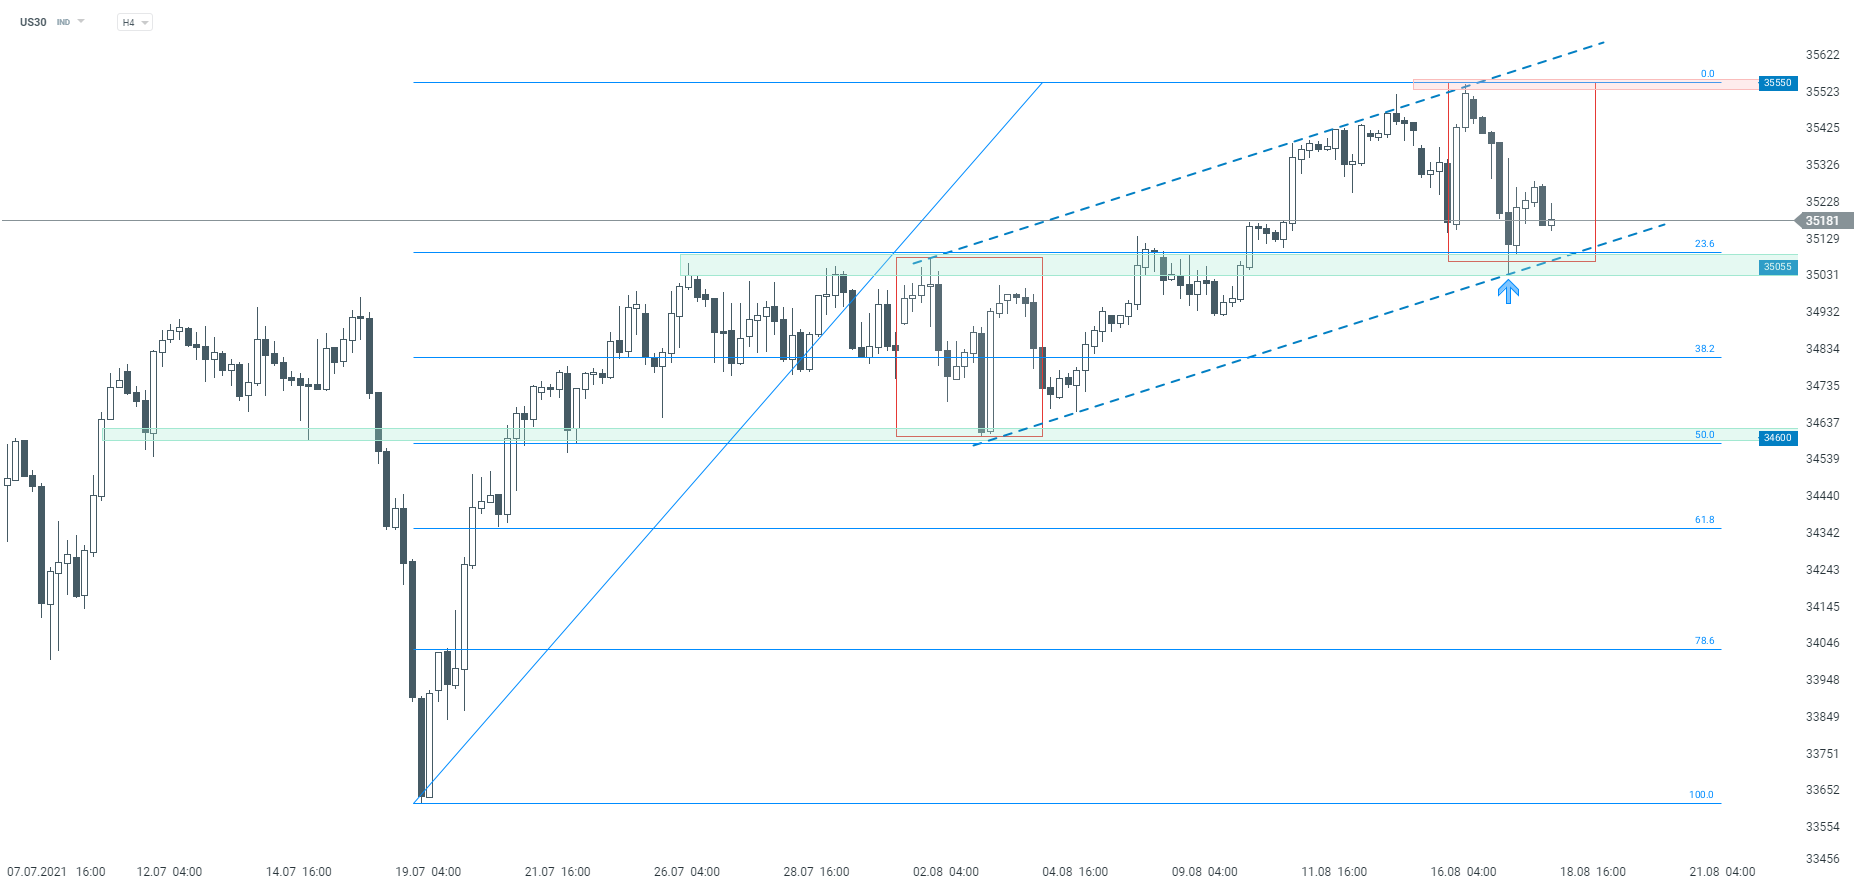 US30 H4 interval. Source: xStation5
EURUSD
Moving on to the EURUSD chart, we can see that the main currency pair has been trading in a downward trend recently. However, looking at the H4 interval, a potential ABC correction can be spotted on the chart (pattern began to form at the beginning of the 2021). If buyers manage to regain control at the 1.17 or 1.16 support, the nearest resistance to watch lies at 1.19 and is marked with the previous price reactions as well as 38.2% Fibonacci retracement. On the other hand, should buyers give up control and the price breaks below the 1.16 handle, the downward move may accelerate.
 EURUSD H4 interval. Source: xStation5
DE30
Last but not least, let’s take a look at the German index - DAX (DE30). Looking at the H4 interval, one can see that the recent upward move stopped at the 127.2% Fibonacci exterior retracement and the downward correction started. However, the market bulls regained control at the earlier broken support area at 15,800 pts. According to the classic technical analysis, as long as the price sits above, the main trend remains upward. On the other hand, if the index resumes decline and the aforementioned 15,800 pts support is breached, the next key support to watch can be found at 15,280 pts, where lies the lower limit of 1:1 structure.
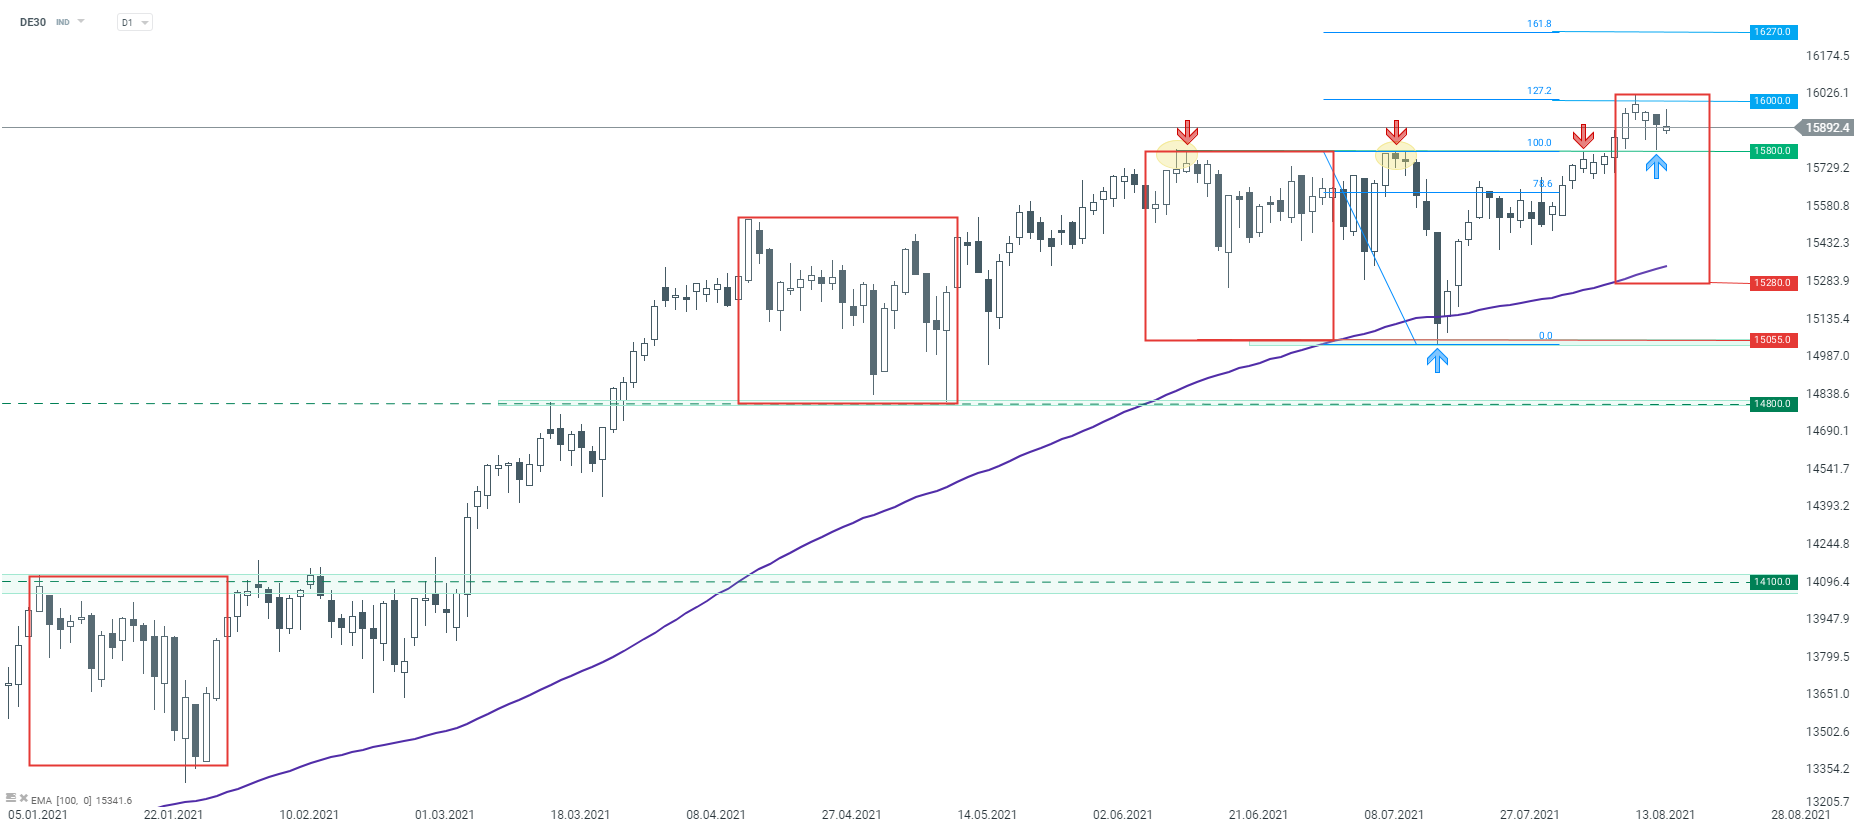 D30 H4 interval. Source: xStation5

GOLD: แรงกดดันฝั่งขายกลับมา ทดสอบแนวรับสำคัญบริเวณ $3,960

🔴Live: ทองโลกกลับ$3,900 ไหม?!

สัปดาห์ข้างหน้า: ราคาน้ำมันพุ่งขึ้น ขณะที่ตลาดหุ้นเผชิญบททดสอบจากผลประกอบการ

🔴Live: ทองโลกพุ่ง $4,100?!