
The cryptocurrency sector is seeing a gradual improvement in sentiment, with Bitcoin slowly overcoming significant resistance on its way to turning the main trend upward. Below we will look at important on-chain indicators that will shed more light on the strength of Bitcoin's current resurgence, which the entire cryptocurrency market is following. Historically, overcoming the 200-session average and the levels of the Realized Price below a year or so before halving proved to be a strong catalyst for increases. At the same time, macroeconomic conditions and a mixed earnings season on Wall Street can still hold back cryptocurrency bulls. What does the on-chain data show?
200 SMA on the D1 interval defeated
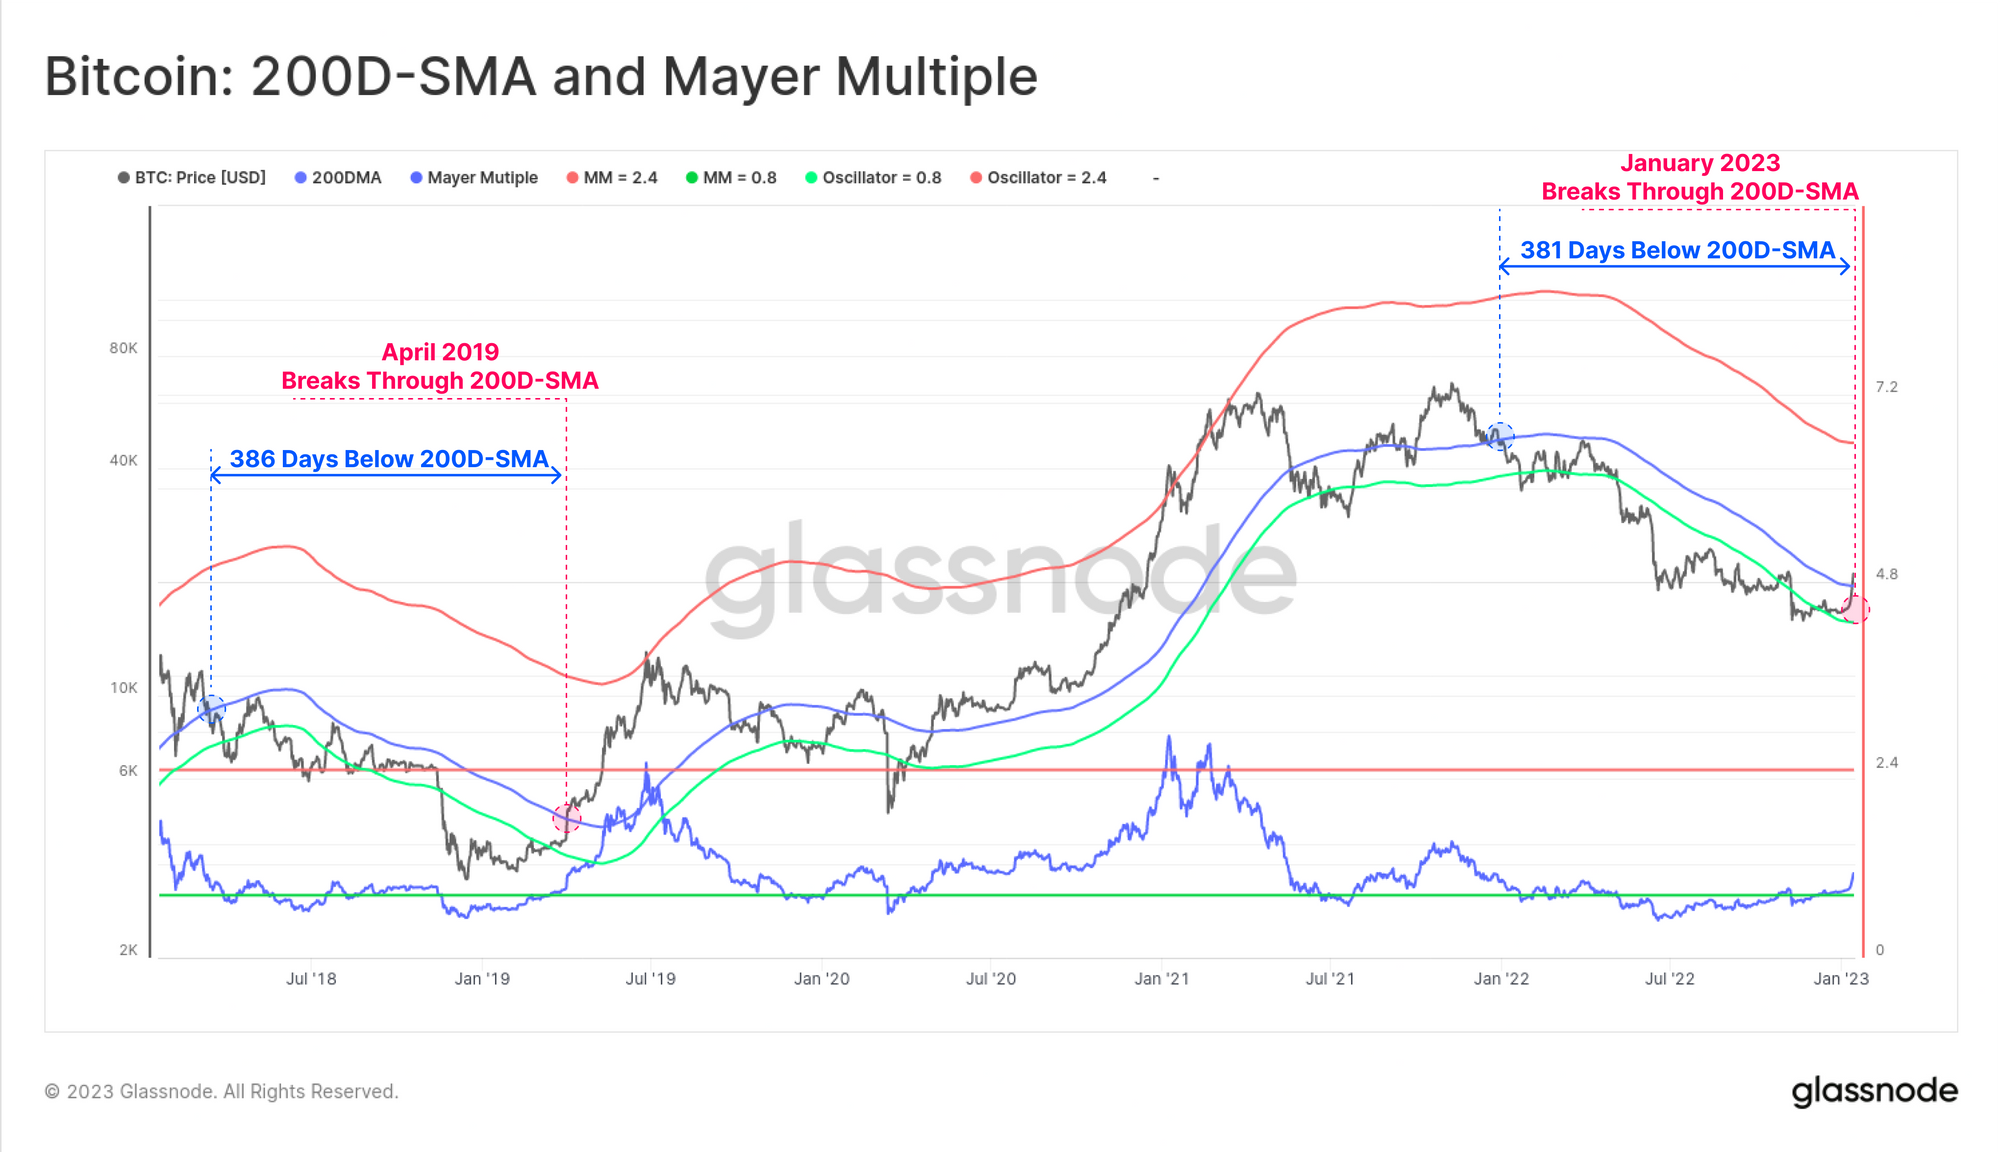
In the current bull market, the 'king of cryptocurrencies' has been below the 200-day moving average for 386 days. Previously in 2018-2019 it was 381 days. The Mayer Multiple indicator dividing Bitcoin's price by the 200-session average rose above levels near 1.0, suggesting a stronger improvement in sentiment and at least a short-term exit from the downtrend. Both of these have historically been indicators suggesting a longer-term rebound and have very rarely proved unreliable, which, however, absolutely does not prejudge their future effectiveness. The price managed to break through significant resistance as financial markets began a rally fueled by falling inflation, and the cryptocurrency industry heaved a sigh of relief as the FTX bankruptcy has so far failed to catalyze another avalanche of bankruptcies. Source: Glassnode
Price again above average 'Realize Price'
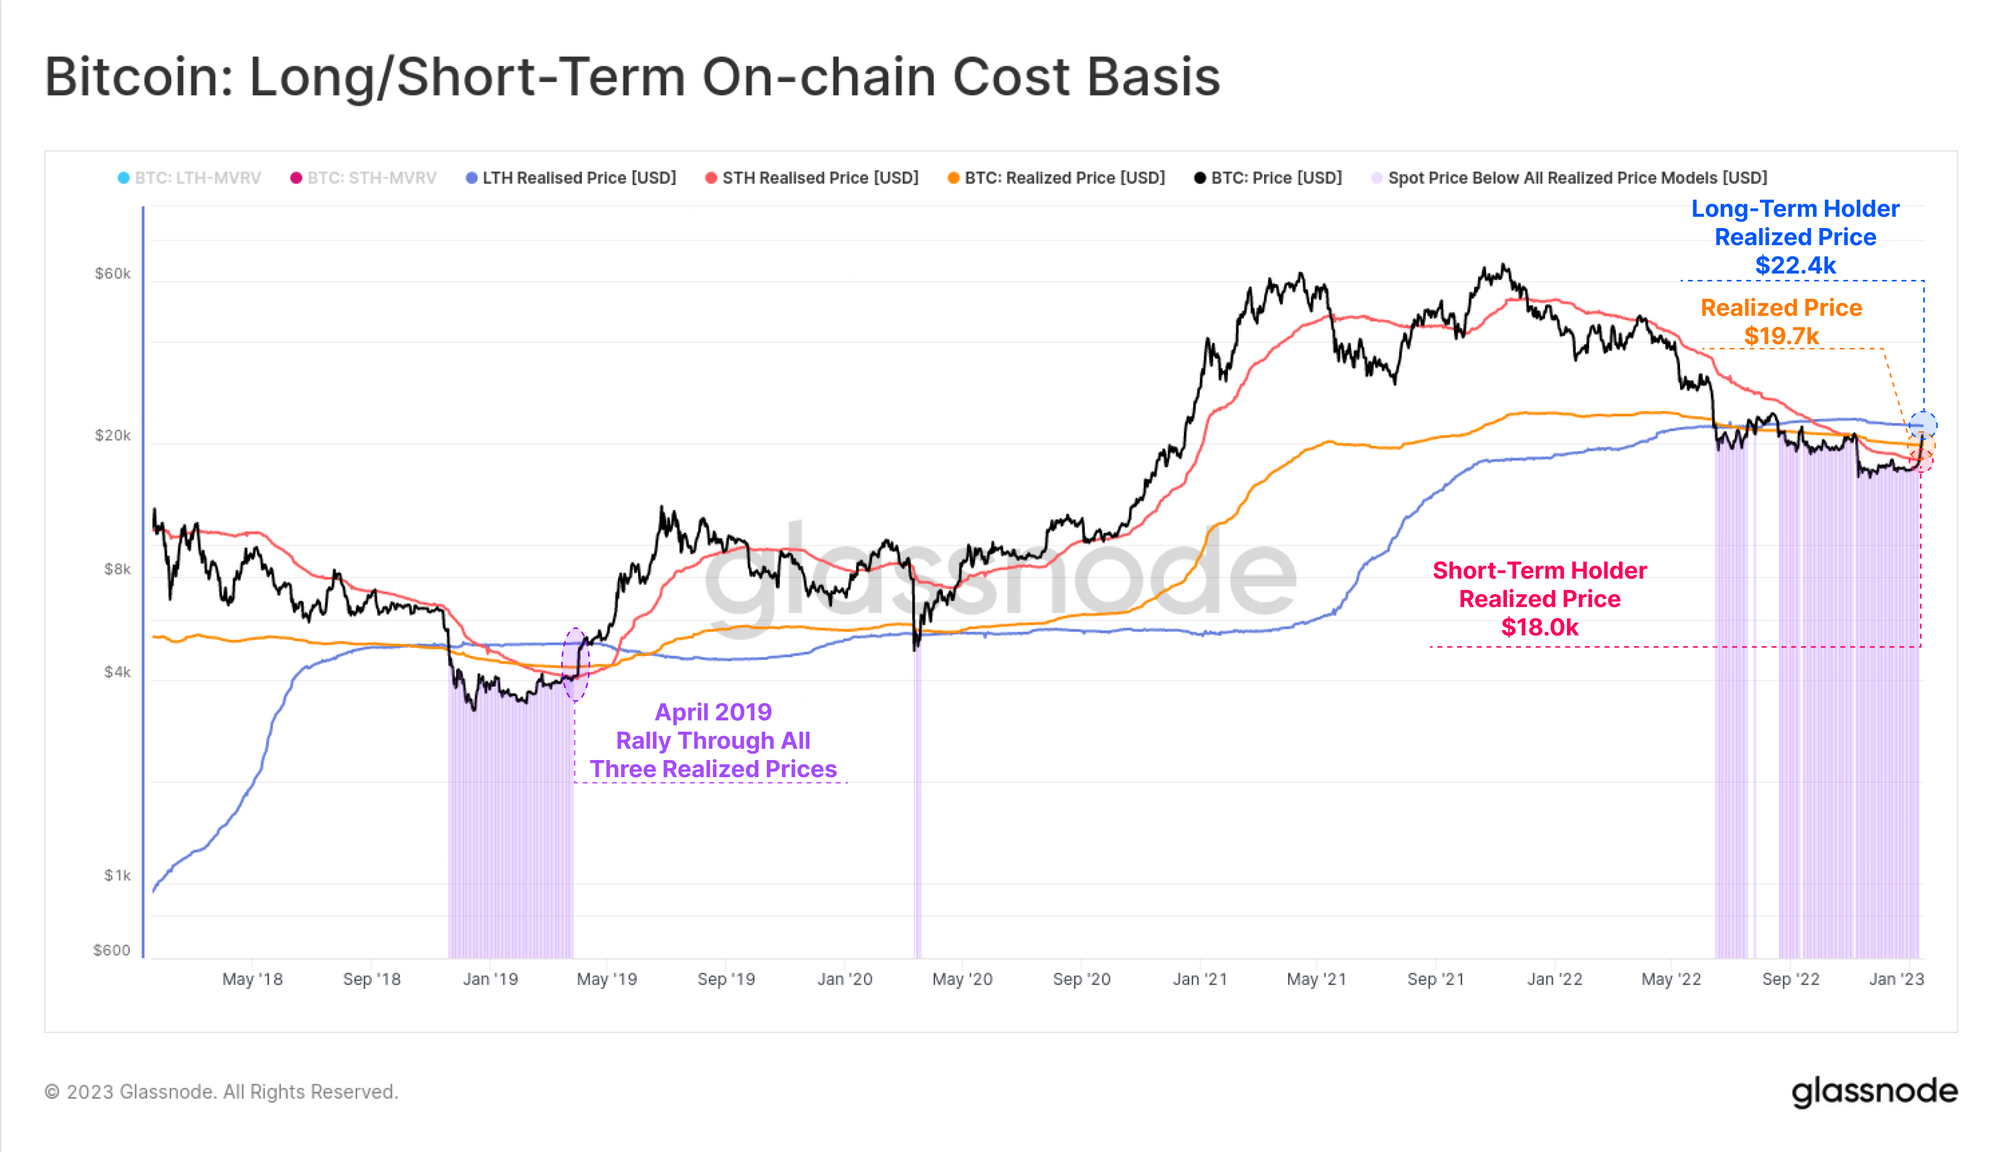 The chart shows average BTC purchase prices on the blockchain by address (Short Term Holders and Long Term Holders). We can see that for short-term investors, the price is more attractive, currently at around $18,000 against the average Realized Price (average historical BTC purchase price) at around $19,700. Long-term investors are still 'under the dash' with an average purchase price in the vicinity of $22,400, but in 2022 they were a loss-averse group so we can expect that they will not be willing to sell this time either, under 'impending halving' conditions. A potential sustained rise in price above $22,400 could herald a gradual improvement in conditions for further increases as the limited supply of particular investor groups along with new demand entering the market could help unleash the Bitcoin price. Source: Glassnode
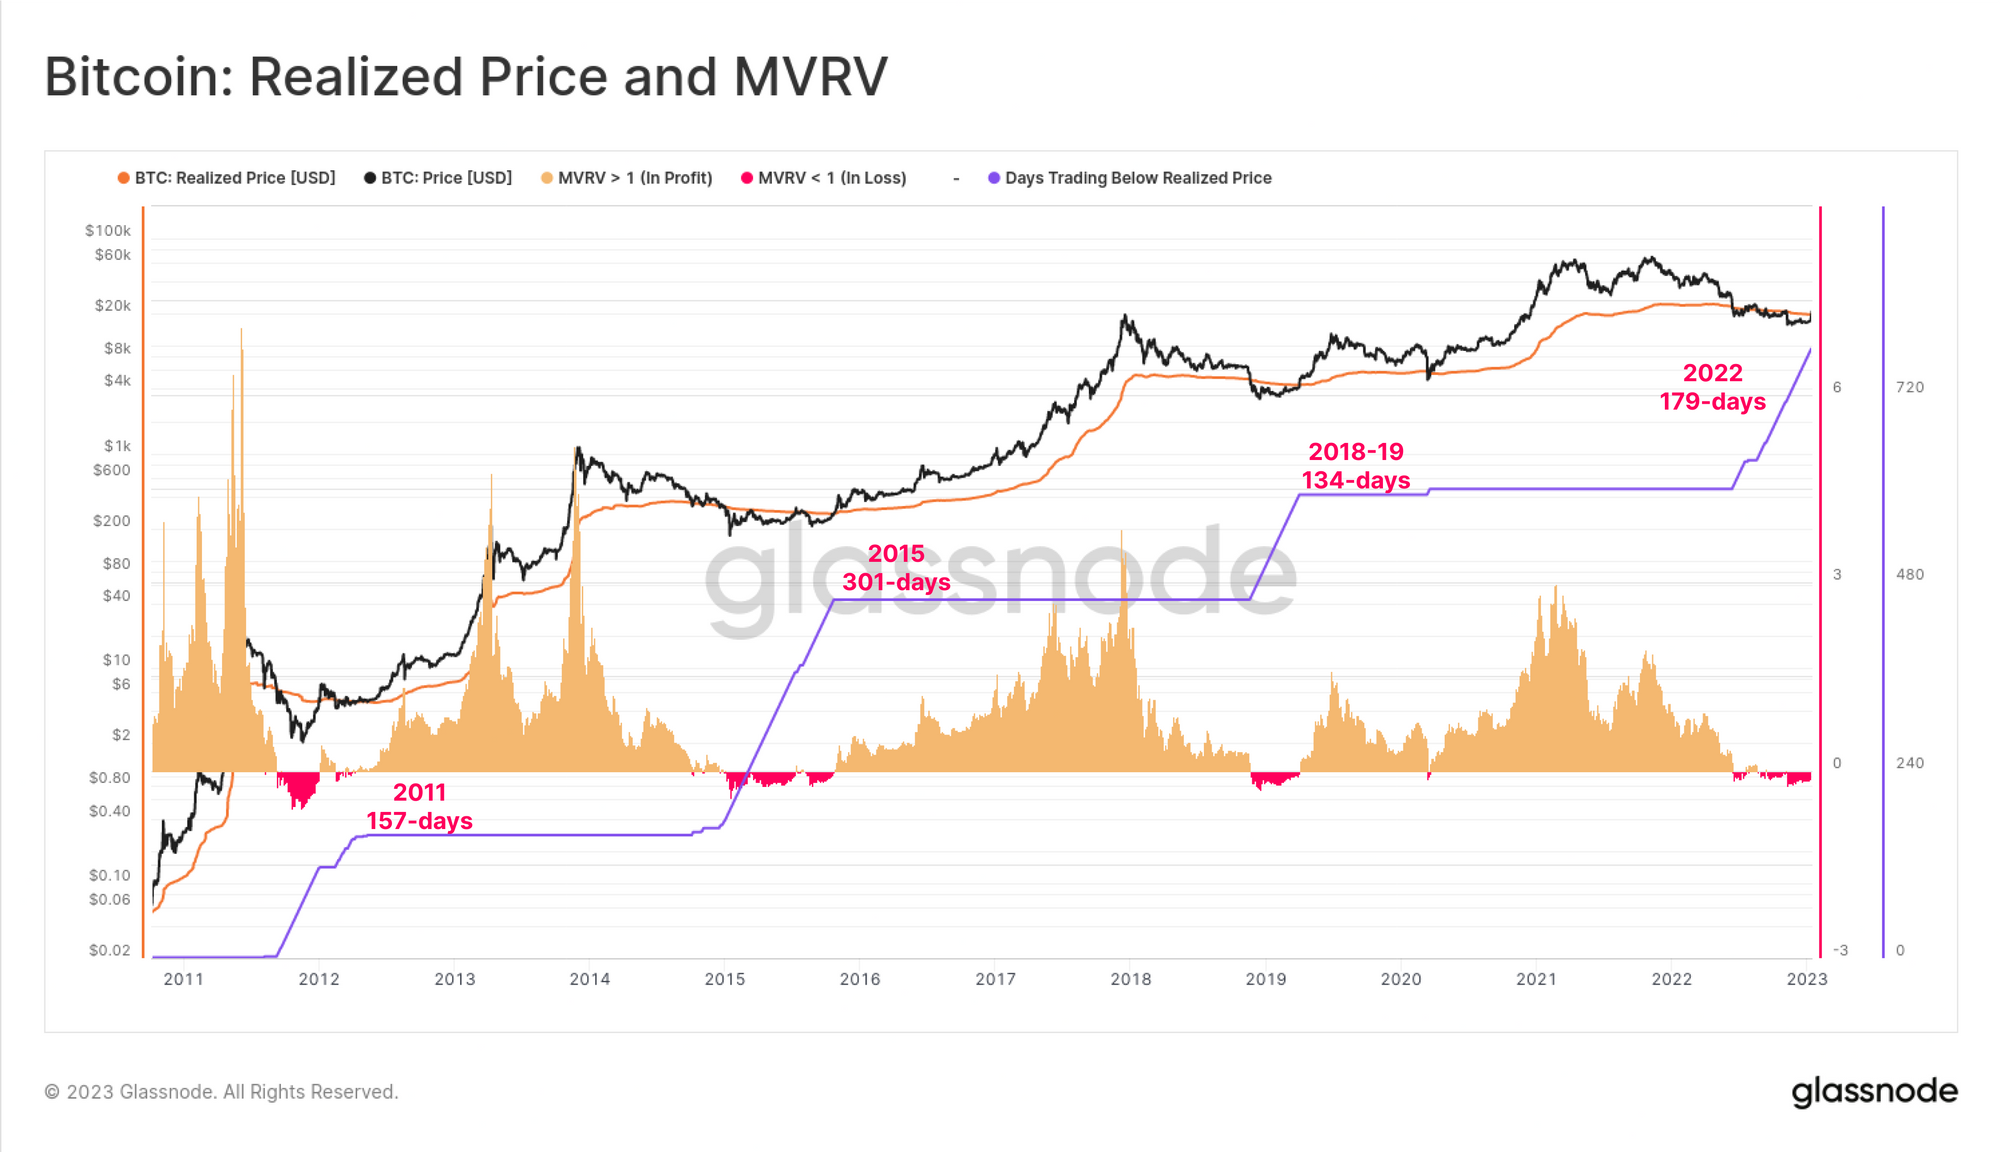 The price in the 2022 bull market was below the realized price for 179 days which is the second 'worst' result comparing it with previous bear markets. The previous time is 134 days. The record 301 days occurred during the 2014-2015 bear market. Source: Glassnode
Lower stress on the BTC mining market
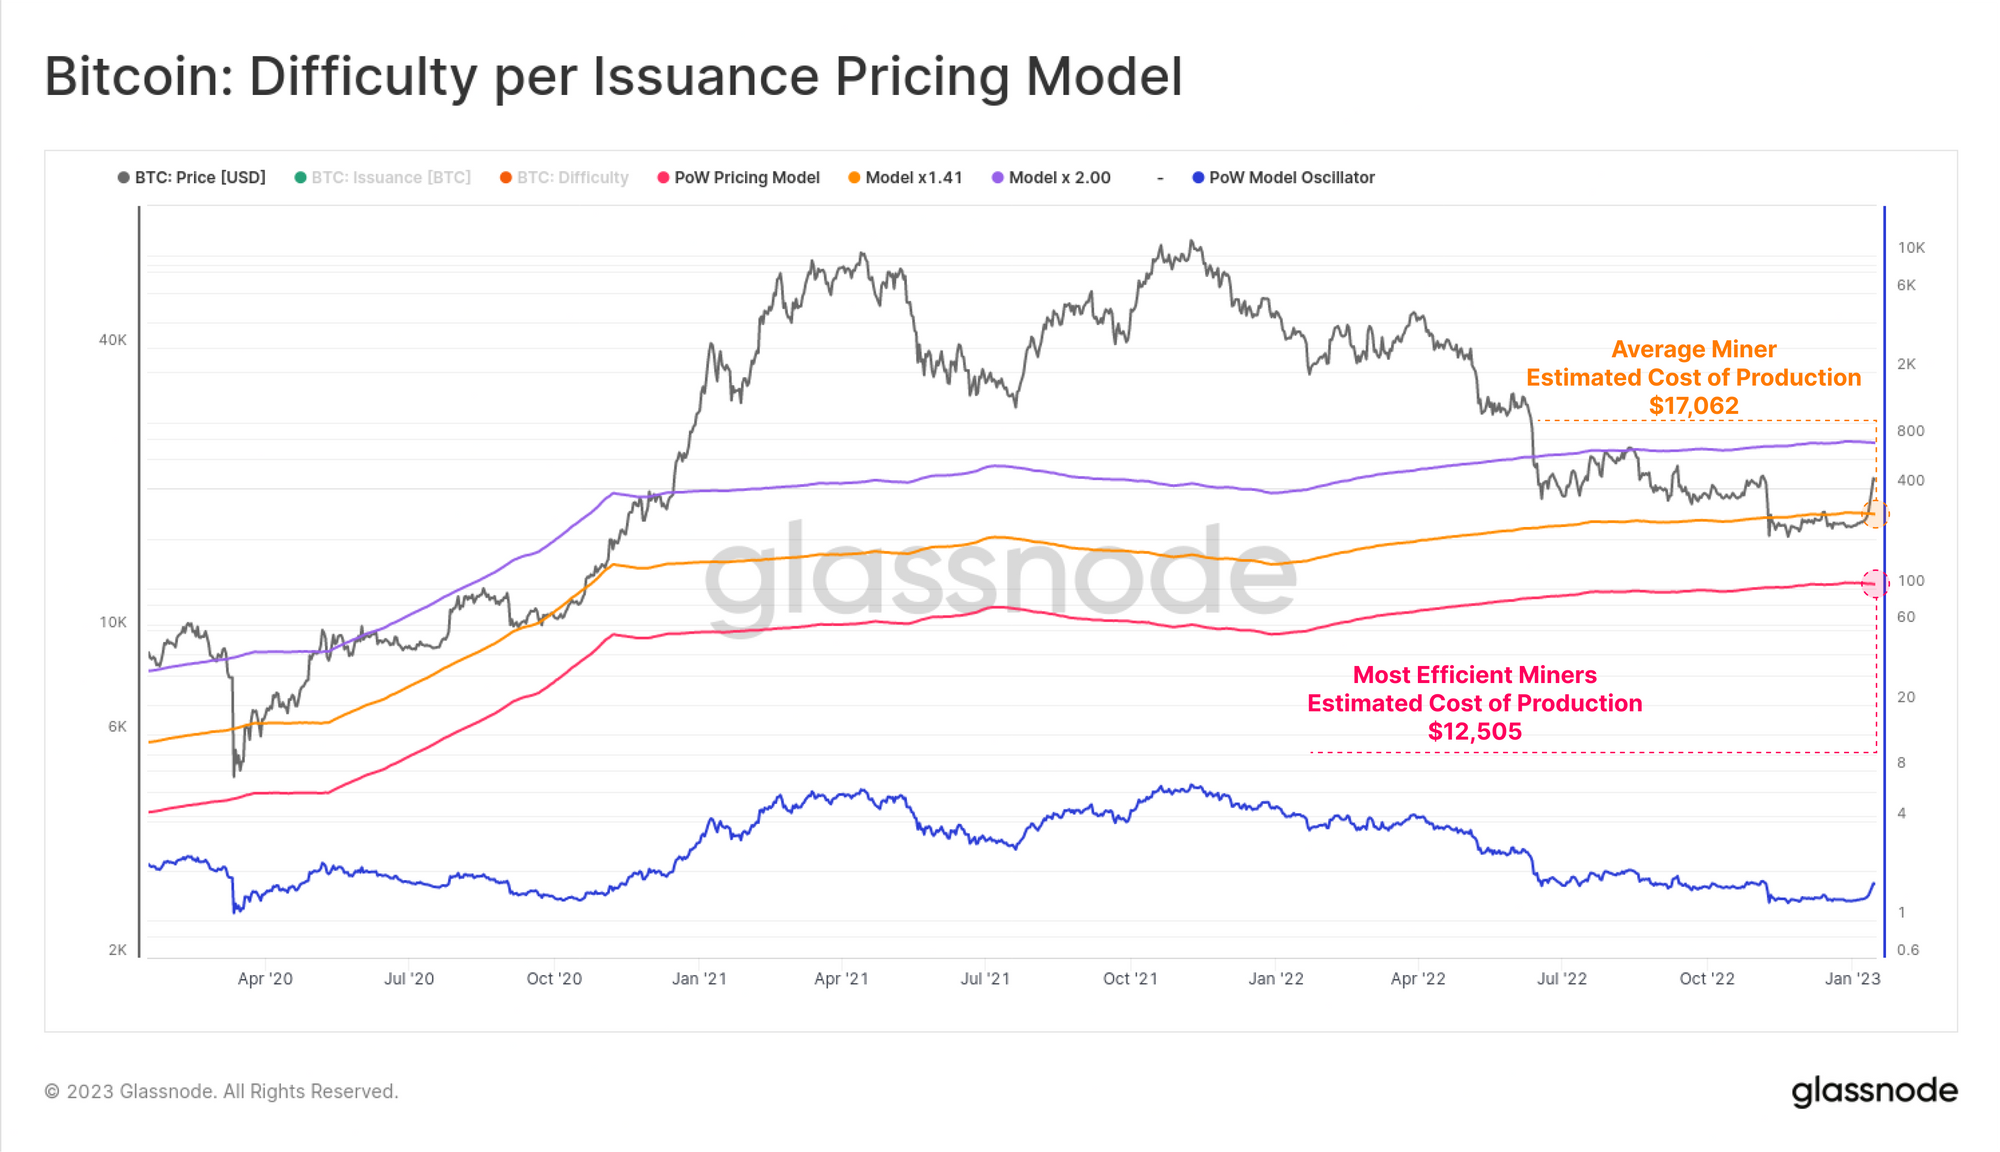
The price of BTC is well above the cost of mining, which could affect the limited supply from miners as global energy prices stabilize and players operating at break-even have suspended operations and dropped out of the market in 2022. The average price of mining BTC for the average miner is currently around $17,000 (although another Glassnode model indicates an average mining cost closer to $18,500) with the most efficient 'miners' able to 'mine' BTC at a much lower cost, hovering around $12,000. In the previous year, miners made up one of the largest 'dormant supply' groups. Source: Glassnode
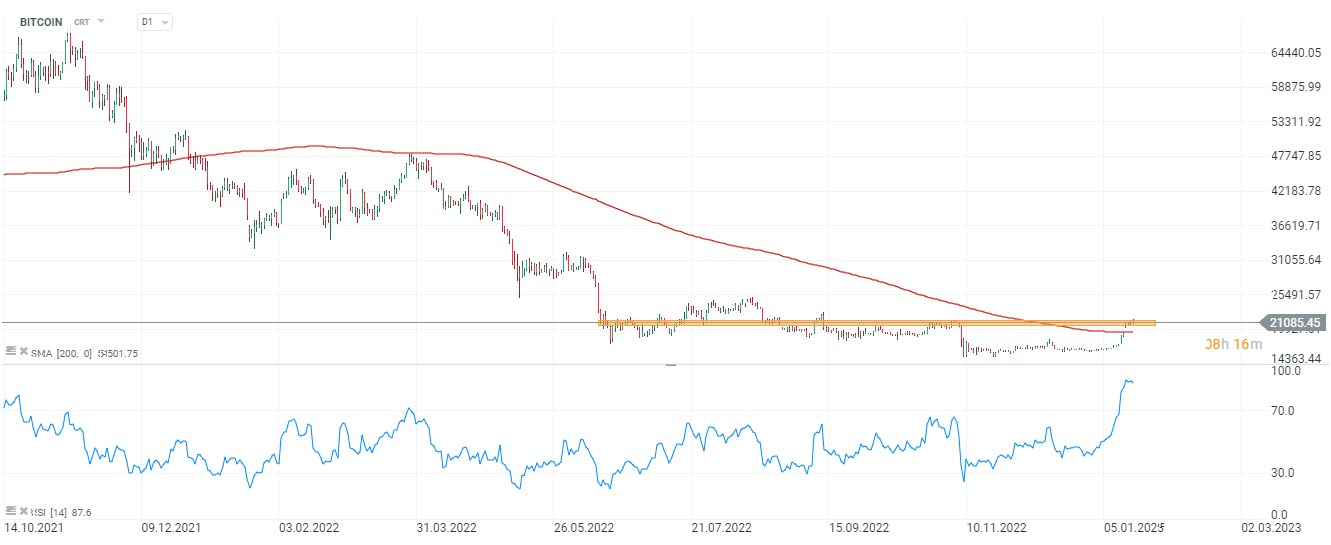 Bitcoin chart, D1 interval. The RSI indicator signals an extreme overbought level near 88 points. The price of BTC has reached key short-term resistance near $21,200, these levels were lost in the face of the sudden bankruptcy of the FTX exchange. A breakout above them could open up gains to the summer 2022 maximums, while a drop back below $20,000 and a potential retest of support at the SMA 200 (red line) could be worrisome. Source: xStation5

ข่าวเด่นวันนี้ 24 ก.ค.

Bitcoin พุ่งเหนือ 66,000 ดอลลาร์ หลังเงินทุนไหลเข้า ETF ฟื้นตัว แต่ Glassnode เตือนความผันผวนอาจเพิ่มขึ้น

Morning Wrap: น้ำมันกลับมายืนเหนือ $90 ขณะที่ AI จากจีนกดดันหุ้นเทคฯ

Morning Wrap: แรงขายกดดันวอลล์สตรีท AI หมดโมเมนตัม Netflix สะดุด อ่าวเปอร์เซียลุกเป็นไฟ