
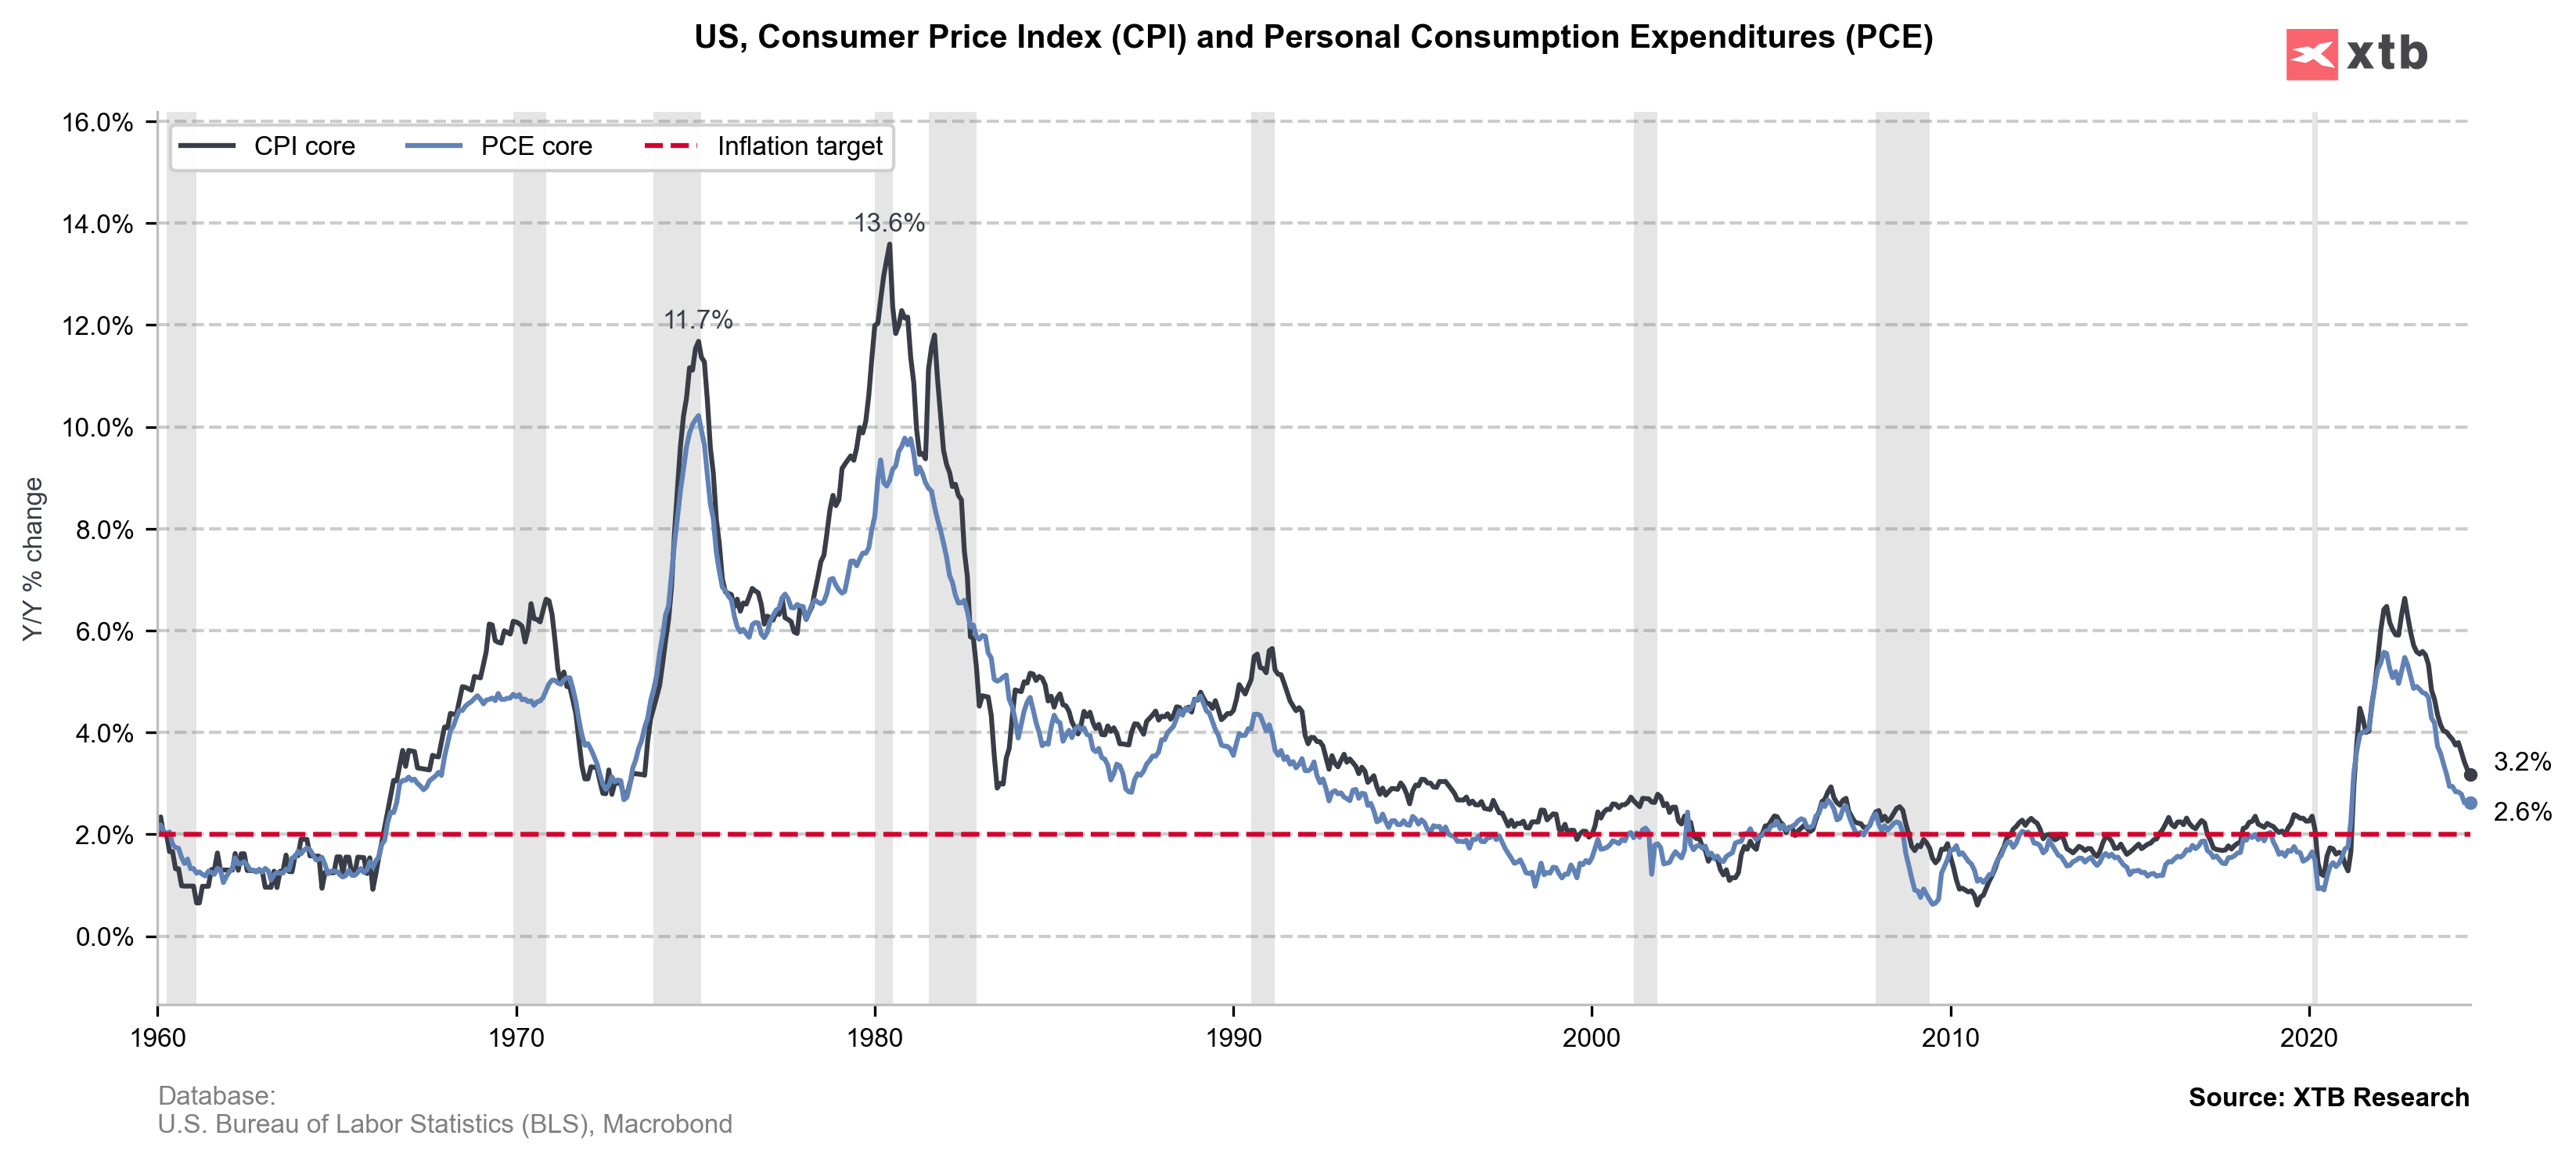
US PCE Price Index YoY Actual 2.5% vs 2.5% expected vs 2.5% previously
US Core PCE Price Index YoY: 2.6% vs 2.7% exp. vs 2.6% previously
- US Real Personal Consumption MoM came in 0.4% vs 0.3% exp. vs 0.2% previously
- US Consumer Spending MoM came in 0.5% in line with 0.5 exp. vs 0.3% previously
- US Personal Income came in 0.3% MoM vs 0.2% exp. vs 0.2% previously
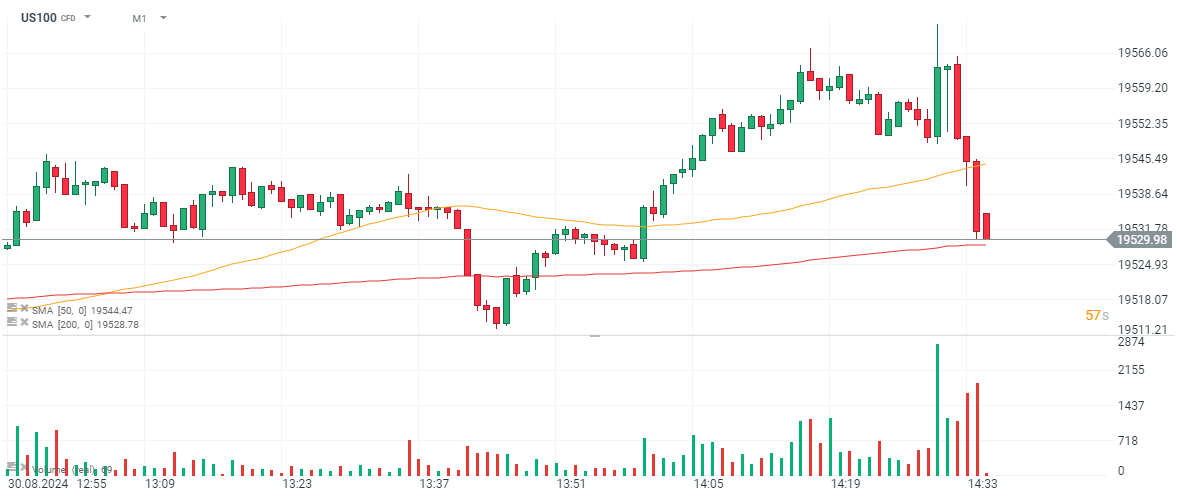
US July PCE price index ex-food/energy/housing came in at 0.1% MoM pace, with ex-energy/housing 0.2% higher on a monthly basis. Quite surprisingly, US100 loses in first reaction after US data, which are signalling further disinflation and solid income / consumer trend across the US economy. Short-term rate-futures on Federal Reserve interest rates, continue to price in a 25 bps Fed rate cut in Sept and 100 bps rate cuts in 2024.

الاحتياطي الفيدرالي يصدر تقريره نصف السنوي. هل أسعار الأسهم مرتفعة، ولكن هل هناك فقاعة؟

e& تعزز مركزها المالي ببيع حصتها في Vodafone.. وسيولة تقارب 6 مليارات دولار تدعم خطط النمو

التقويم الاقتصادي: شركة إس كيه هاينكس وسوق العمل الكندي هما أبرز أحداث اليوم 💡

السعودية تفرض رسوماً 2% على تملك غير السعوديين للعقار في 4 مدن رئيسية