
Cryptocurrencies are extending declines at the start of the week. Bitcoin lost nearly 0.7% at the start of Monday's session, Ethereum nearly 1.5%, and Solana nearly 2.2%. On Friday, we observed another consecutive daily net outflow of nearly $190 million from spot ETFs.
The extension of the downward momentum increases the chance that the most popular cryptocurrency could test another important technical support point, which is marked by both the 100-day exponential moving average (purple curve in the chart below; running in the $64,000 zone) and the realized price of short-term BTC holders, which represents the average purchase price of Bitcoin by portfolios with an average holding period for these digital assets of less than 155 days.
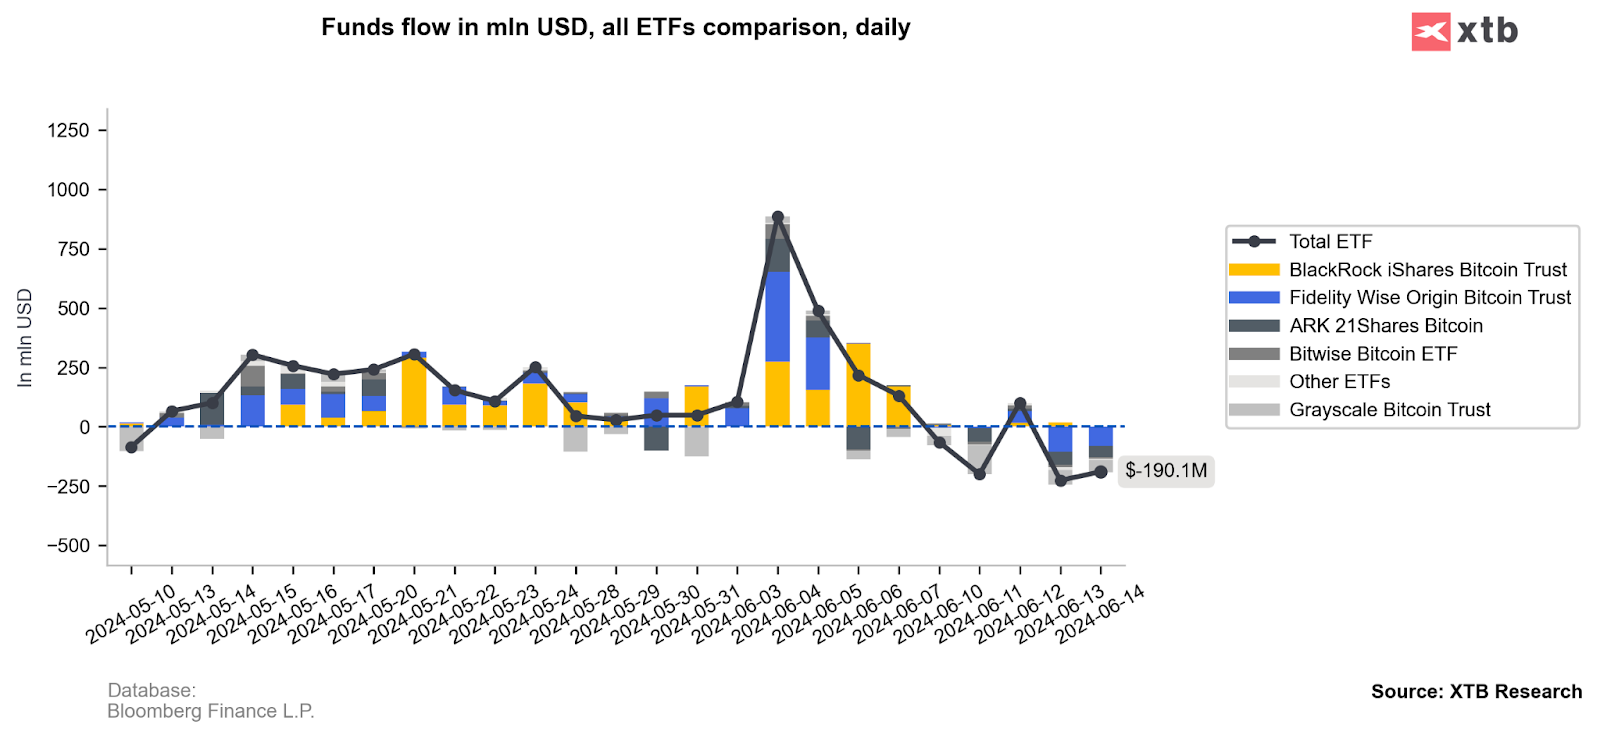
The ETF data indicates further net outflows from BTC spot funds. Source: XTB
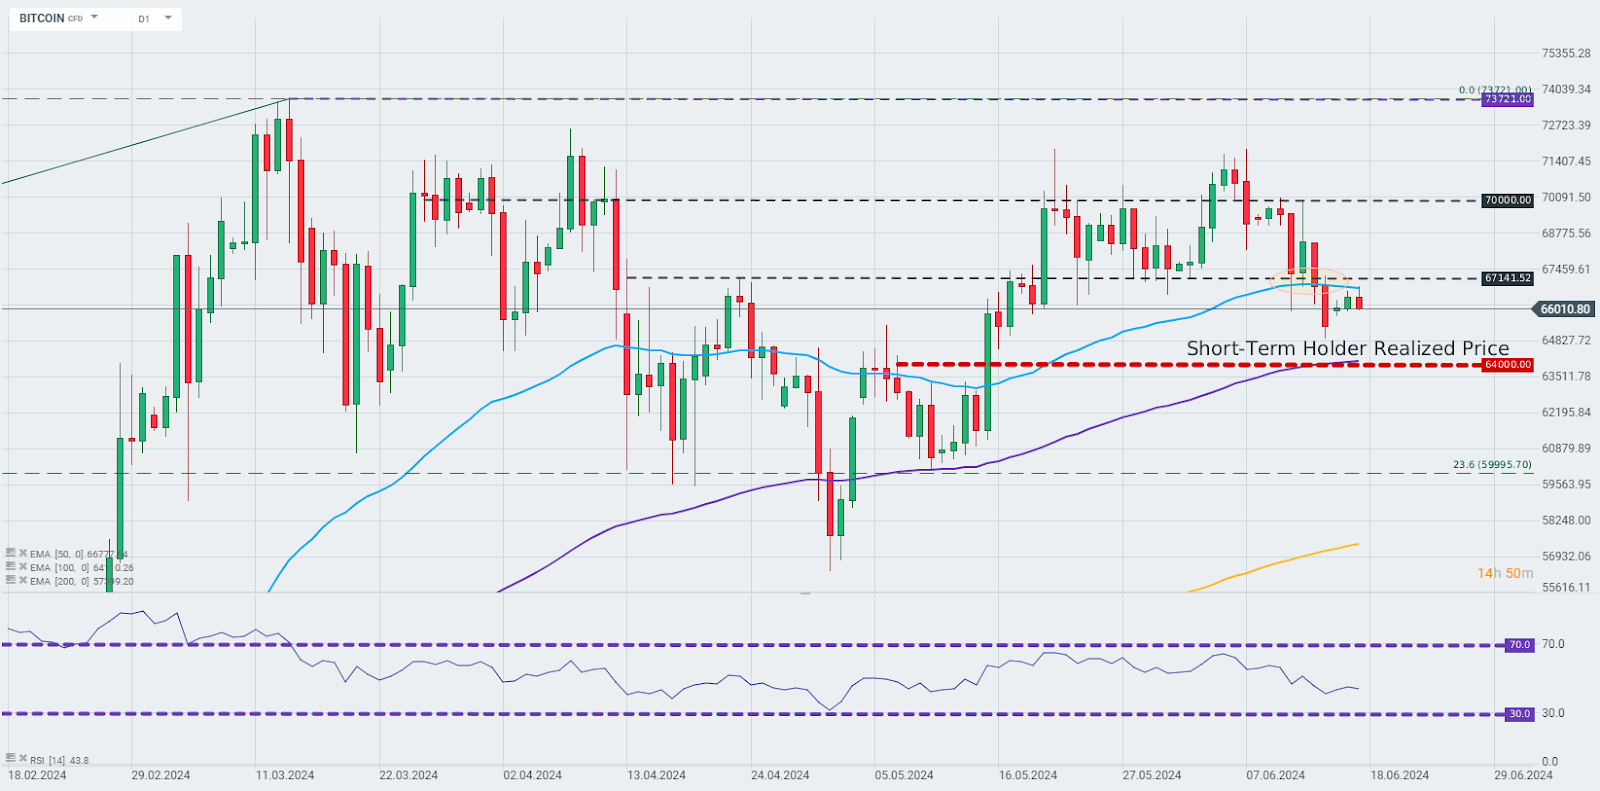
Bitcoin was unable to break above the barrier set by the 50-day exponential moving average (blue curve) and thus the cryptocurrency extended the downward wave. Source: xStation 5

ارتفاع البيتكوين فوق 66 ألف دولار مع تعافي تدفقات صناديق المؤشرات المتداولة، لكن شركة جلاسنود تحذر من تقلبات أعلى.

حصاد الاسواق: النفط يرتفع مجدداً فوق 90 دولاراً مع تأثير الذكاء الاصطناعي الصيني على أسهم شركات التكنولوجيا.

حصاد الأسواق: استمرار عمليات بيع أسهم شركات التكنولوجيا وتصعيد الصراع الأمريكي الإيراني

ملخص اليوم: 📉 يومٌ أحمر في مختلف الأسواق. قطاع الذكاء الاصطناعي يُثقل كاهل وول ستريت، والمعادن النفيسة تحت ضغط.