
USDCHF has broken below the neckline of the head and shoulders pattern recently. According to classic technical analysis, this pattern heralds trend reversal and breaking below the neckline proceeds the final downward impulse. Nevertheless, the sell-off has been halted at the support zone in the 0.9050 area, marked with previous price reactions and exterior 161.8% retracement. Should we see a break below this area, sell-off may accelerate towards the lower limit of the yellow box marked on the chart below (textbook range of the breakout from head and shoulders pattern). On the other hand, should recovery continue, the earlier-broken neckline is the key near-term support to watch.
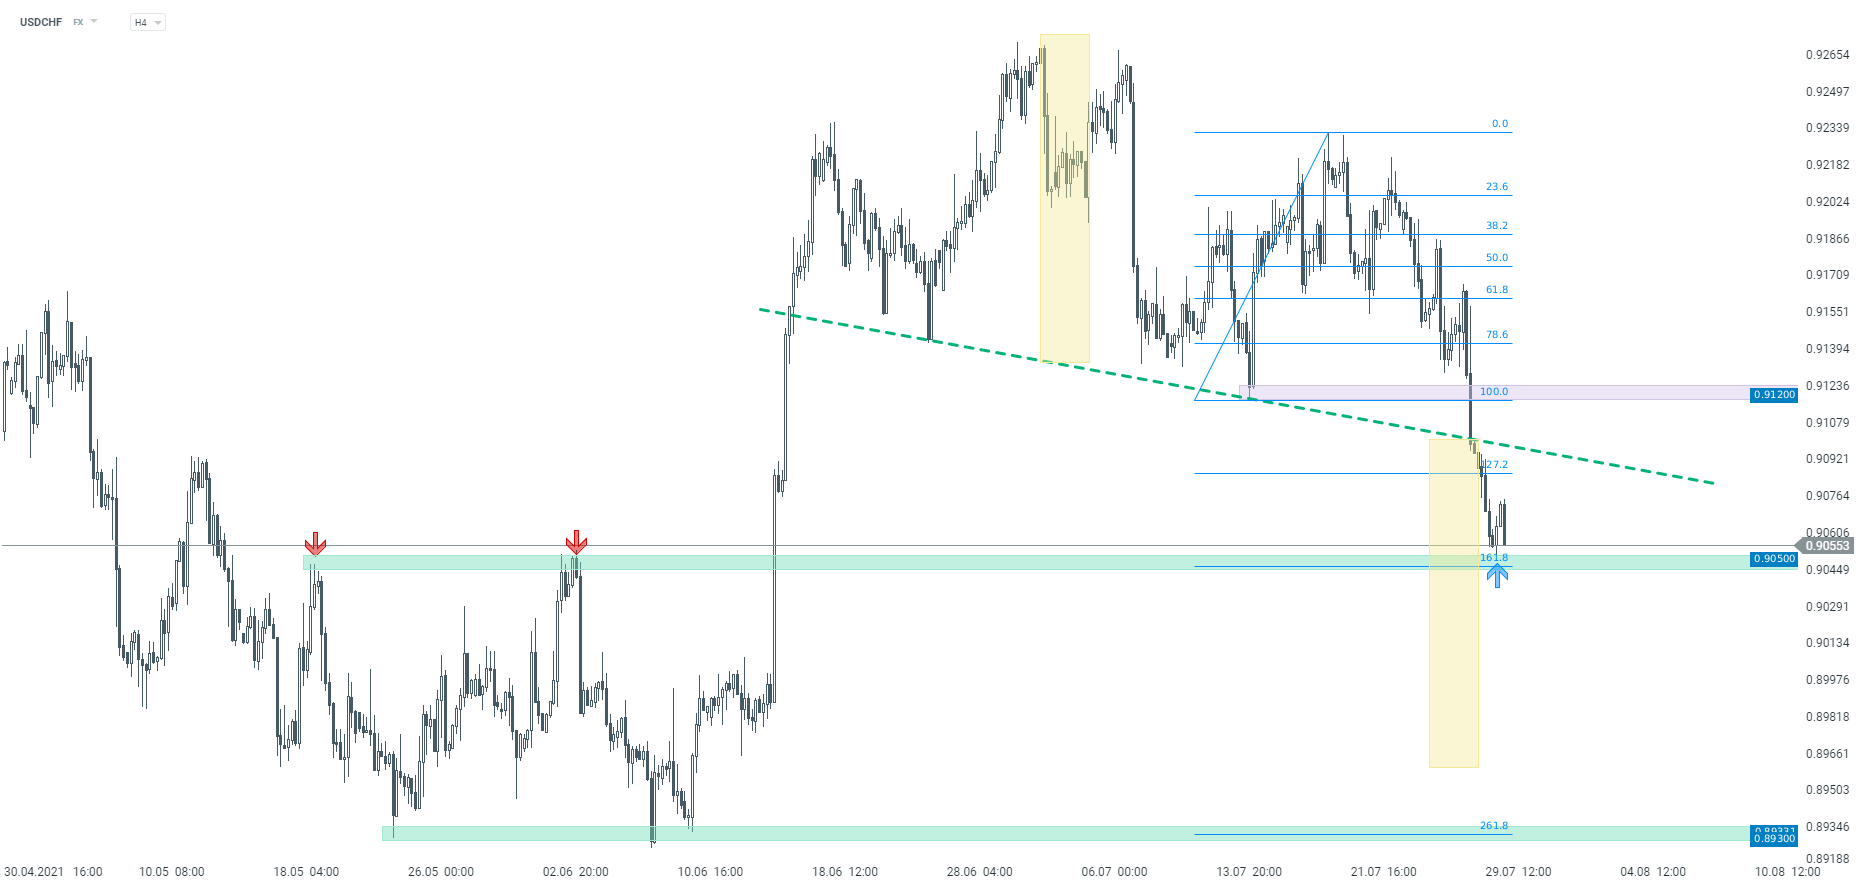 Source: xStation5

ملخص اليوم: وول ستريت تستعيد عافيتها؛ تدخل جديد في سوق الين؟

ثلاثة أسواق يجب مراقبتها الأسبوع المقبل (31 يوليو 2026)

ملخص السوق: الأسهم الأوروبية تسجل أعلى مستوياتها في ثلاثة أسابيع! انخفاض سهم أبل في تداولات ما قبل افتتاح السوق الأمريكية!

مخطط لليوم: EURUSD بعد اجتماع الاحتياطي الفيدرالي. السوق يخفض توقعات رفع سعر الفائدة