
The EUR/USD has retested a key support zone, which led to the cessation of the sell-off in the currency pair.
This support zone, identified at 1.07, has been supporting the price since November 2023 and may also be regarded as the lower boundary of the current medium-term consolidation.
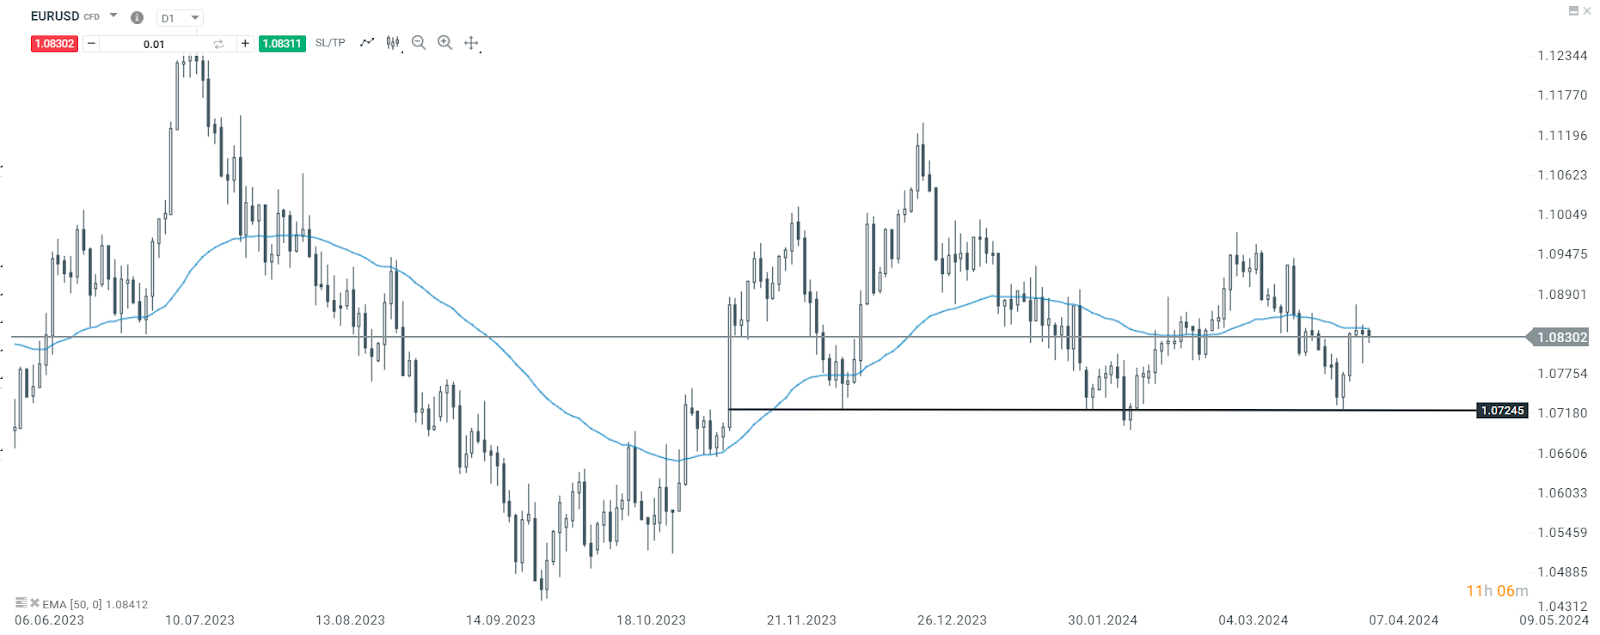
EUR/USD Daily time frame chart. Source: xStation 5
However, on the 4-hour chart, it's apparent that the price is approaching the first significant obstacle that could determine the next momentum in the pair. The downward trend line initiated at the end of February this year and has been extending since.
If buyers succeed in breaking above this zone, the upward movement could be prolonged. Conversely, if sellers regain control of the price at this juncture, a new downward trend cannot be discounted, potentially towards the 50-period EMA.
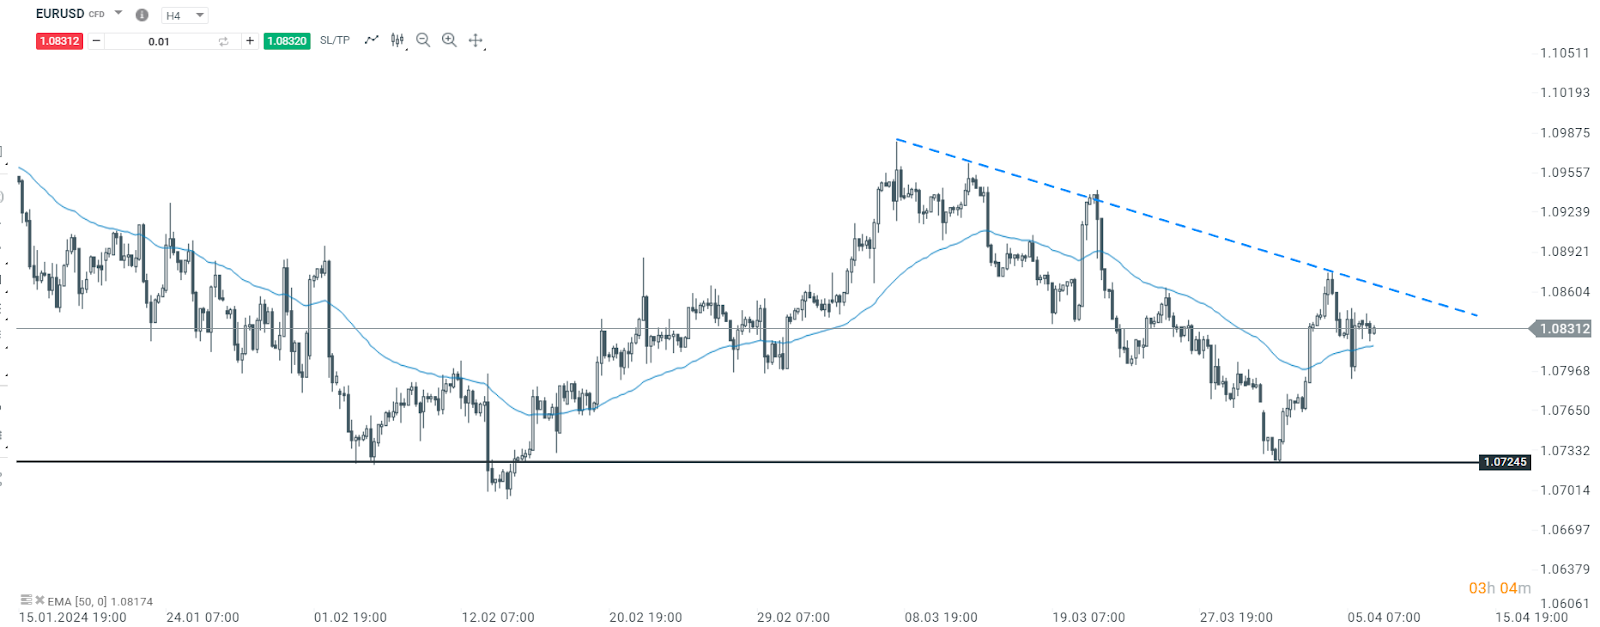
Eur/usd. 4 hours time frame chart. Source: xStation 5
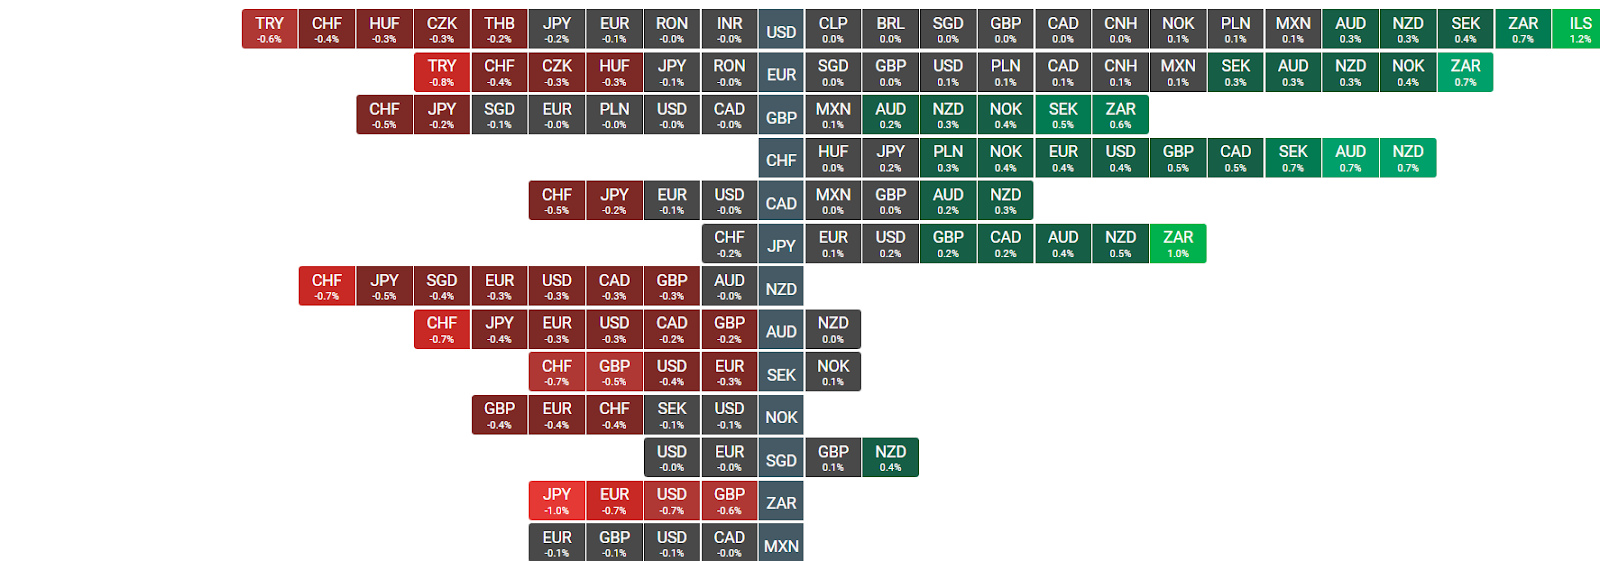
Forex Heatmap. Source: xStation 5
Henrique Tomé,Analyst Portugal

الجدول الزمني الاقتصادي: يوم الأربعاء يحمل معه نتائج أرباح الربع الثاني الكبيرة وتضخم أسعار المنتجين. (15.07.2026)

حصاد الأسواق: ما هي الخطوة التالية فيما يتعلق بمضيق هرمز والتضخم وأسعار الفائدة الأمريكية؟ (15.07.2026)

ملخص اليوم: انخفاض التضخم وضعف الدولار يدفعان الذهب و S&P 500 نحو الارتفاع.

جلسة أسئلة وأجوبة مع رئيس الاحتياطي الفيدرالي كيفن وارش من شهادته أمام الكونغرس: استقرار التضخم عامل أساسي