
The average spring wheat yield in North Dakota, the top-producing state, was estimated at 29.1 bushels per acre in late July by the annual Wheat Quality Council tour, the lowest on record going back to 1993 due to a severe drought in the northern Plains. On top of these supply concerns, demand from China is still very high. Since then, WHEAT prices continue to recover and trade at more than 2 months high. Is there any chance for further rises ?
Daily interval :
After crossing the daily Ichimoku cloud, making a local high at 718 cents per bushel (B), the bullish signal has been rejected by the lagging span (red box), failing to emerge from the cloud as well. A sharp decline followed, making a local low near the Kijun line (blue line). Since then, a new bullish signal has been made by prices, which this time was confirmed by the lagging-span (green box). Since the beginning of the week, the bulls have failed to break through a key resistance : 23,6% retracement. Breaking under this aforementioned level could lead to further rise around April high at 770 cents per bushel (D). On the other hand, the next support can be found around the Ichimoku cloud on 38,2% retracement.
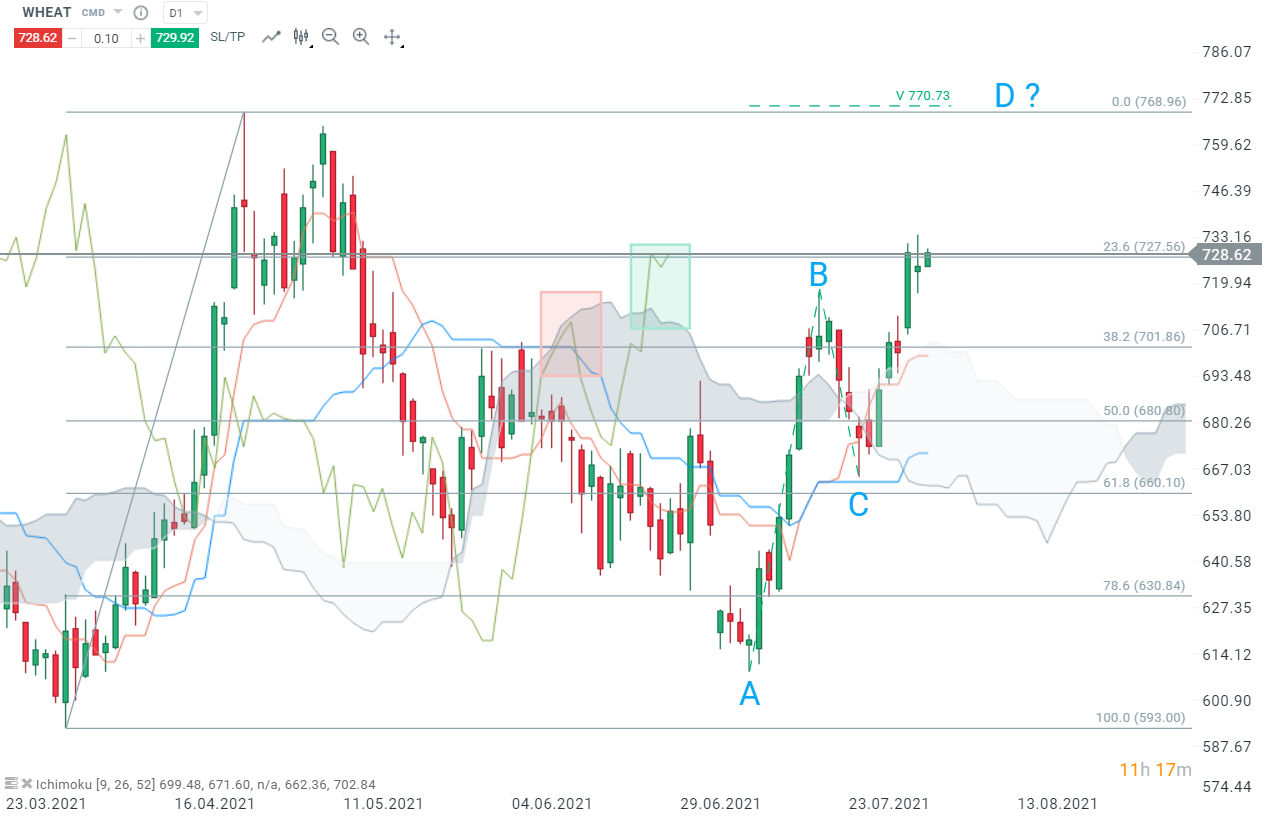
WHEAT, D1 interval, Source : xStation5
H4 interval :
As one can notice, late July decline has been stopped by the H4 Ichimoku cloud, followed by a new bullish signal after prices manage to emerge from the cloud. The Tenkan (red line) acted as a support during the recent upward move. A break below this level would be a warning signal and could lead to a pullback to the kijun (blue line) at 709 cents per bushel. As long as the Tenkan is not broken, the continuation of the rise is the main scenario.
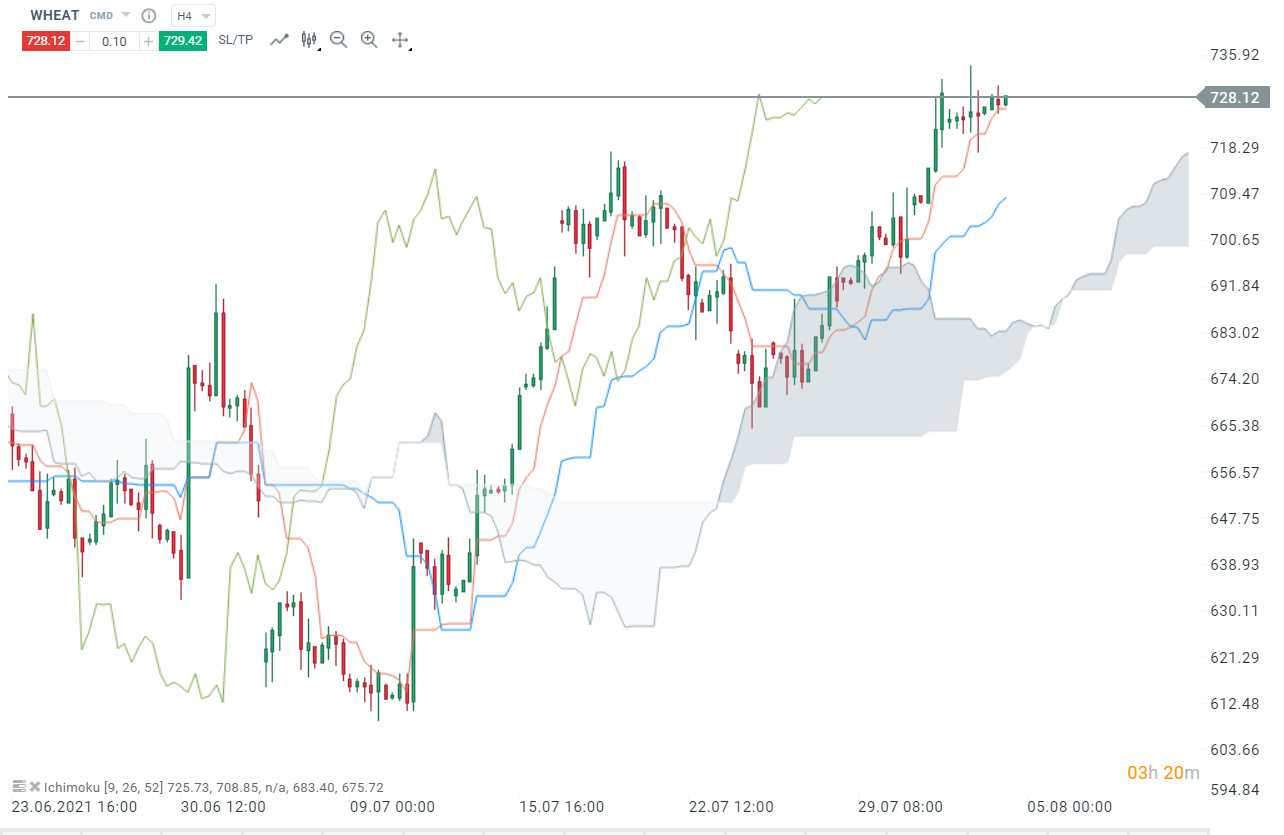 WHEAT, H4 interval, Source : xStation5
Réda Aboutika, XTB France

🛢️ تراجع خام برنت من 90 دولارًا

التقويم الاقتصادي: الضغوط التضخمية في ألمانيا وكندا إلى جانب حزمة البيانات الاقتصادية لبولندا

حصاد الاسواق: النفط يرتفع مجدداً فوق 90 دولاراً مع تأثير الذكاء الاصطناعي الصيني على أسهم شركات التكنولوجيا.

ملخص اليوم: موجة بيع مع تبعات