



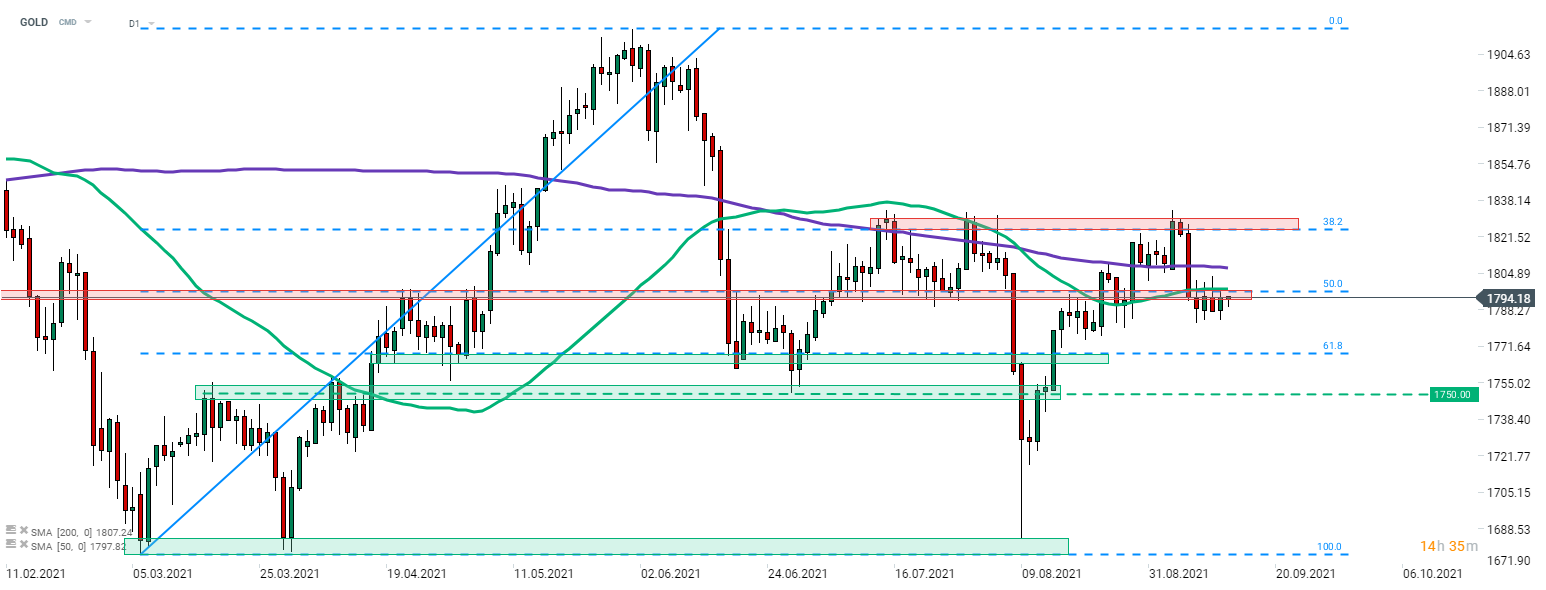
Gold took a hit last week and pulled back from the area marked with 38.2% retracement ($1,825 area) to 50% retracement of the upward move launched in March 2021 ($1,795 area). While declines were halted slightly below the aforementioned 50% retracement, bulls struggled to launch a recovery move and the precious metal traded sideways. Attempts to return back above the $1,800 mark were halted by the 50-session moving average (green line). In case we see a pullback from here, the next support to watch can be found at 61.8% retracement ($1,768). GOLD may become more active this afternoon near 1:30 pm BST as US CPI inflation reading for August will be released.
While the market expects a slight deceleration in headline and core gauge, it should be noted that previous 5 releases showed faster price growth than expected. Having said that, one cannot rule out that we will see a beat today as well. Another acceleration in price growth could be negative for gold price as it would put more pressure on the Fed to begin tightening its policy.
 Source: xStation5


Economic Calendar: PMI ภาคบริการสำคัญของยุโรปและสหรัฐฯ พร้อมจับตาการตัดสินใจจากธนาคารกลาง


Morning Briefing: ดอลลาร์แข็งค่า น้ำมันร่วง EURUSD แตะระดับต่ำสุดในรอบหลายเดือน


🟡 ทองคำพักตัว เพราะน้ำมัน ไม่ใช่ NFP


ราคาน้ำมันร่วงเกือบ 5% หลังยุโรปประกาศปล่อยน้ำมันดีเซลสำรอง 💡