
Gold price took a hit yesterday and dropped $15 per ounce. Unless a major recovery occurs today, gold may experience the largest monthly drop since November 2016. Drop in prices yesterday was accompanied by strengthening of the US dollar. Taking a look at GOLD at monthly time frame, we can see that a bearish engulfing pattern surfaced on the chart. In theory, this is a bearish signal but will not be confirmed until the current monthly candlestick closes.
Taking a look at GOLD at lower, daily time frame, we can see that the price pulled back and is testing the support zone in the $1,760 area. Breaking below this hurdle would pave the way for a test of the next major support in the $1,690 area.
Today's ADP employment report release may have an impact on USD and therefore on gold as well. Traders should stay on guard near 1:15 pm BST.
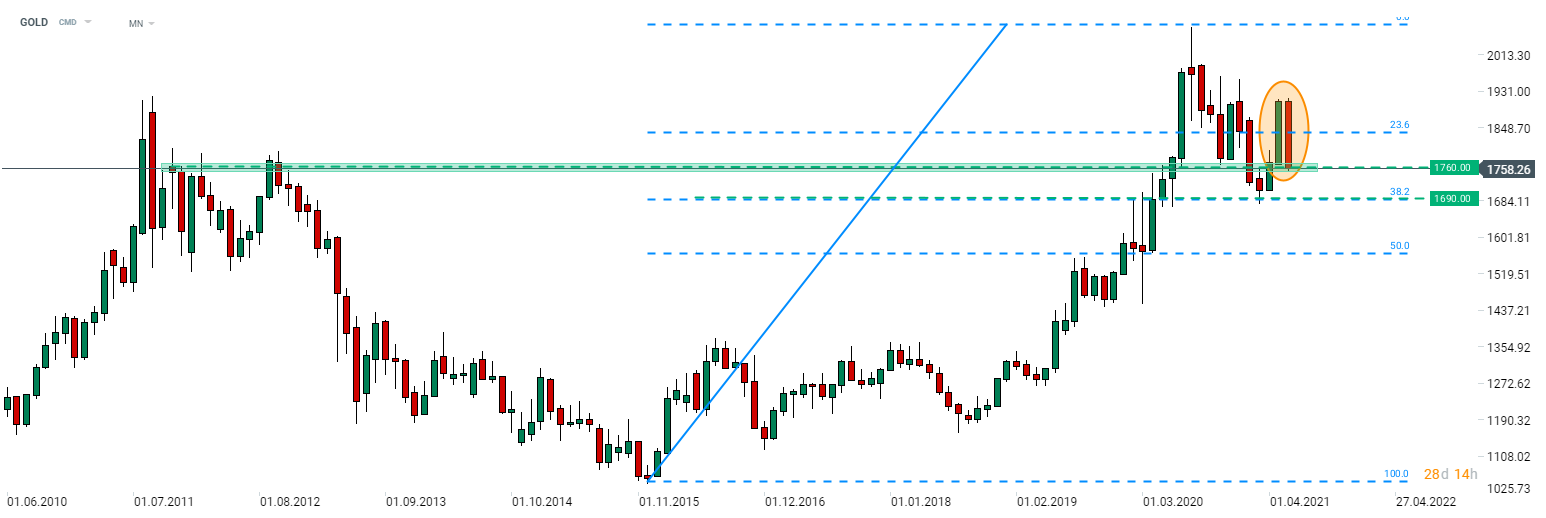 GOLD painted a bearish engulfing pattern at monthly time frame. Source: xStation5
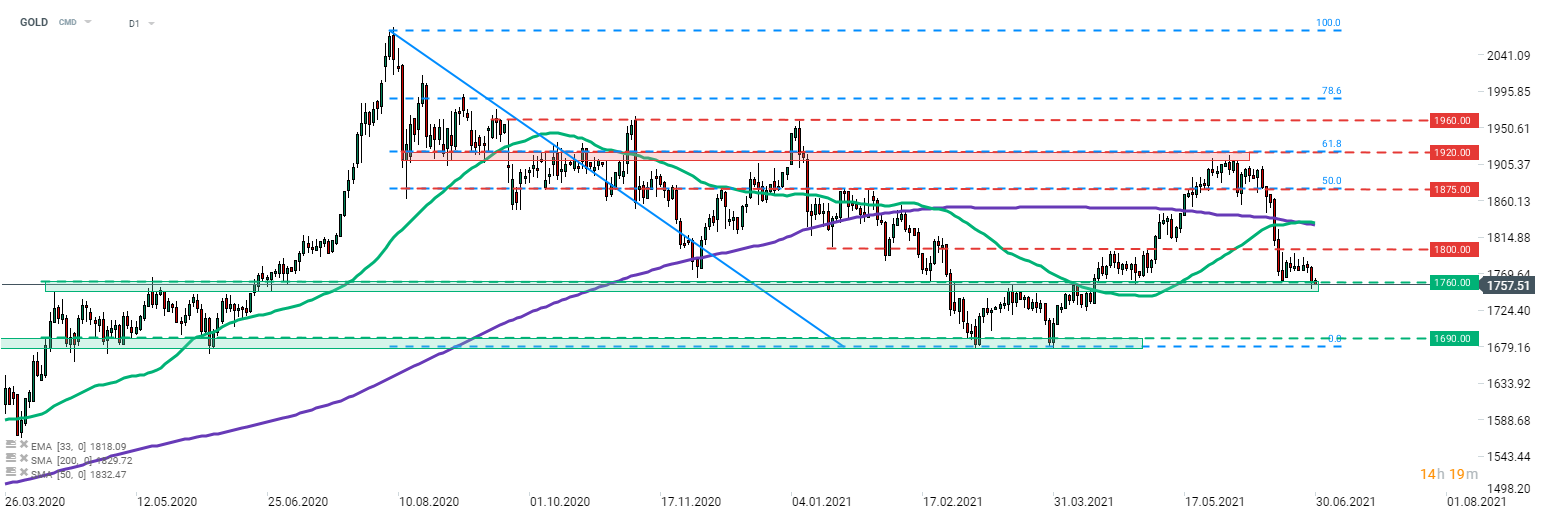 GOLD at daily time frame. Source: xStation5

ข่าวเด่นวันนี้ 30 ก.ค.

กาแฟและโกโก้ร่วงแรง หลังเผชิญแรงเทขายหนัก

⚫ สต็อกน้ำมันดิบสหรัฐฯ ลดลงครั้งใหญ่ หนุนราคาน้ำมันพุ่งต่อ

GOLD - ความระมัดระวังปกคลุมตลาดก่อนการประชุม Fed