
Markets are slowly getting into a Christmas lull with volatility across major financial markets dropping as we approach trading week's end. Economic calendar is a bit more abundant today than in the previous days of the week, especially in the afternoon. Investors will be offered US monthly personal spending and income data as well as durable goods orders data for November, PCE core inflation, jobless claims and a Canadian monthly GDP reading for October. All of those data reports will be released at the same time - at 1:30 pm GMT. While neither of those releases alone would be enough to trigger a big move in the markets, their combination may provide some short-term volatility.
Taking a look at the USDCAD chart at D1 interval, we can see that the pair broke above the 1.2825 mark last week but bulls failed to hold onto those gains. The pair started to pull back this week and is now testing the aforementioned 1.2825 price zone as a support. Note that even if we see a break back below this hurdle, it does not mean that recovery is lost. The final support, marked with the lower limit of local market geometry, can be found at 1.2725. Only a break below this area would hint at a reversal of short-term trend.
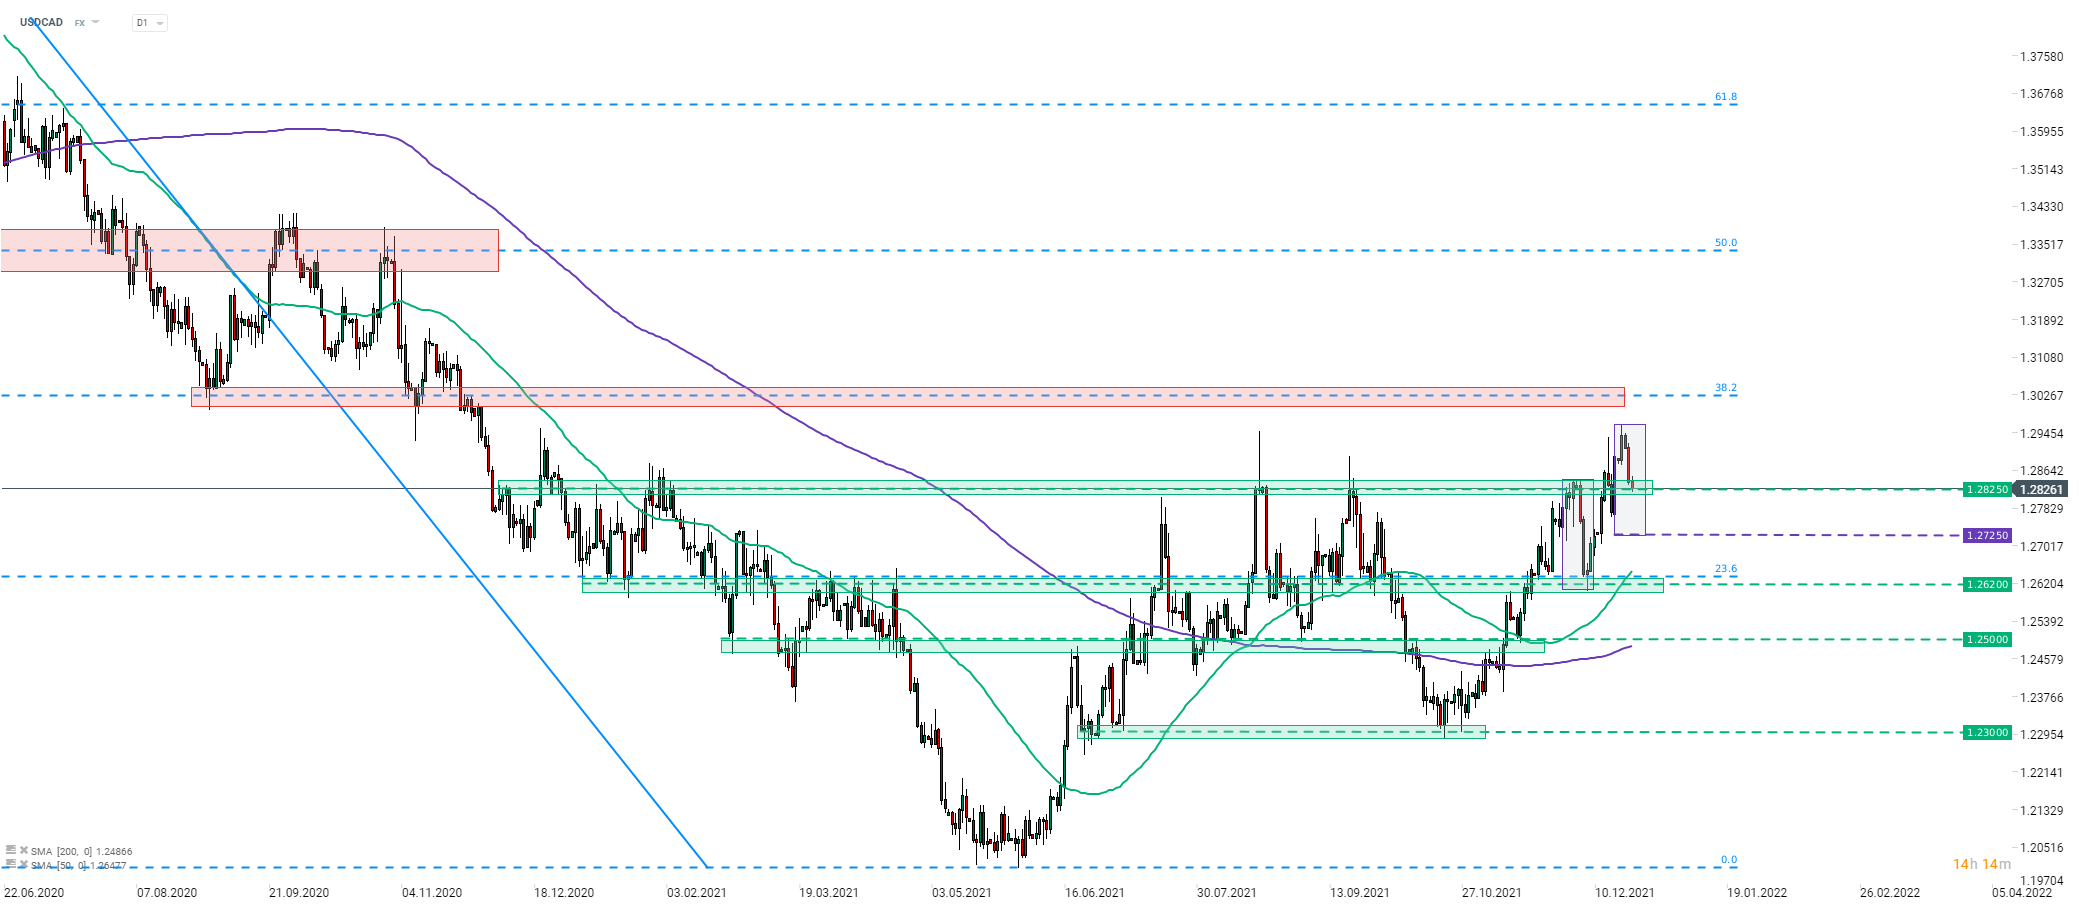 Source: xStation5

ข่าวเด่นวันนี้ 30 ก.ค.

Warsh ไม่ได้ส่งสัญญาณ Hawkish ชัดเจน ตลาดมอง Dovish มากขึ้น EUR/USD แตะ 1.1450
BREAKING: Fed คงดอกเบี้ย ท่ามกลางความเห็นต่างภายใน และการชะลอจุดยืนของ Warsh

Chart of the Day: เงินเฟ้อกดดัน AUDUSD! 'เหยี่ยว' RBA กำลังเปลี่ยนท่าที?