The US dollar has been on the rise recently. Situation was driven by a bond sell-off that has led to a massive pick-up in US Treasury yields. The 10-year yields climbed above the 4.60% mark and were closing in on the 4.70% mark yesterday. However, a reversal occurred later on - bonds recouped earlier losses with 10-year yields dropping back below 4.60% and this has also triggered a pullback on the USD market.
Taking a look at the USD index (USDIDX) chart at D1 interval, we can see that the index gained over 7% during the past 2 months and reached 106.50 - the highest levels since late-November 2022. However, USDIDX has already dropped around 1% off the highs and is approaching a medium-term price zone ranging around 38.2% retracement of the downward move launched in September 2022. The lower limit of the Overbalance structure can be found near the lower end of this zone and a break below would hint at a potential bearish trend reversal.
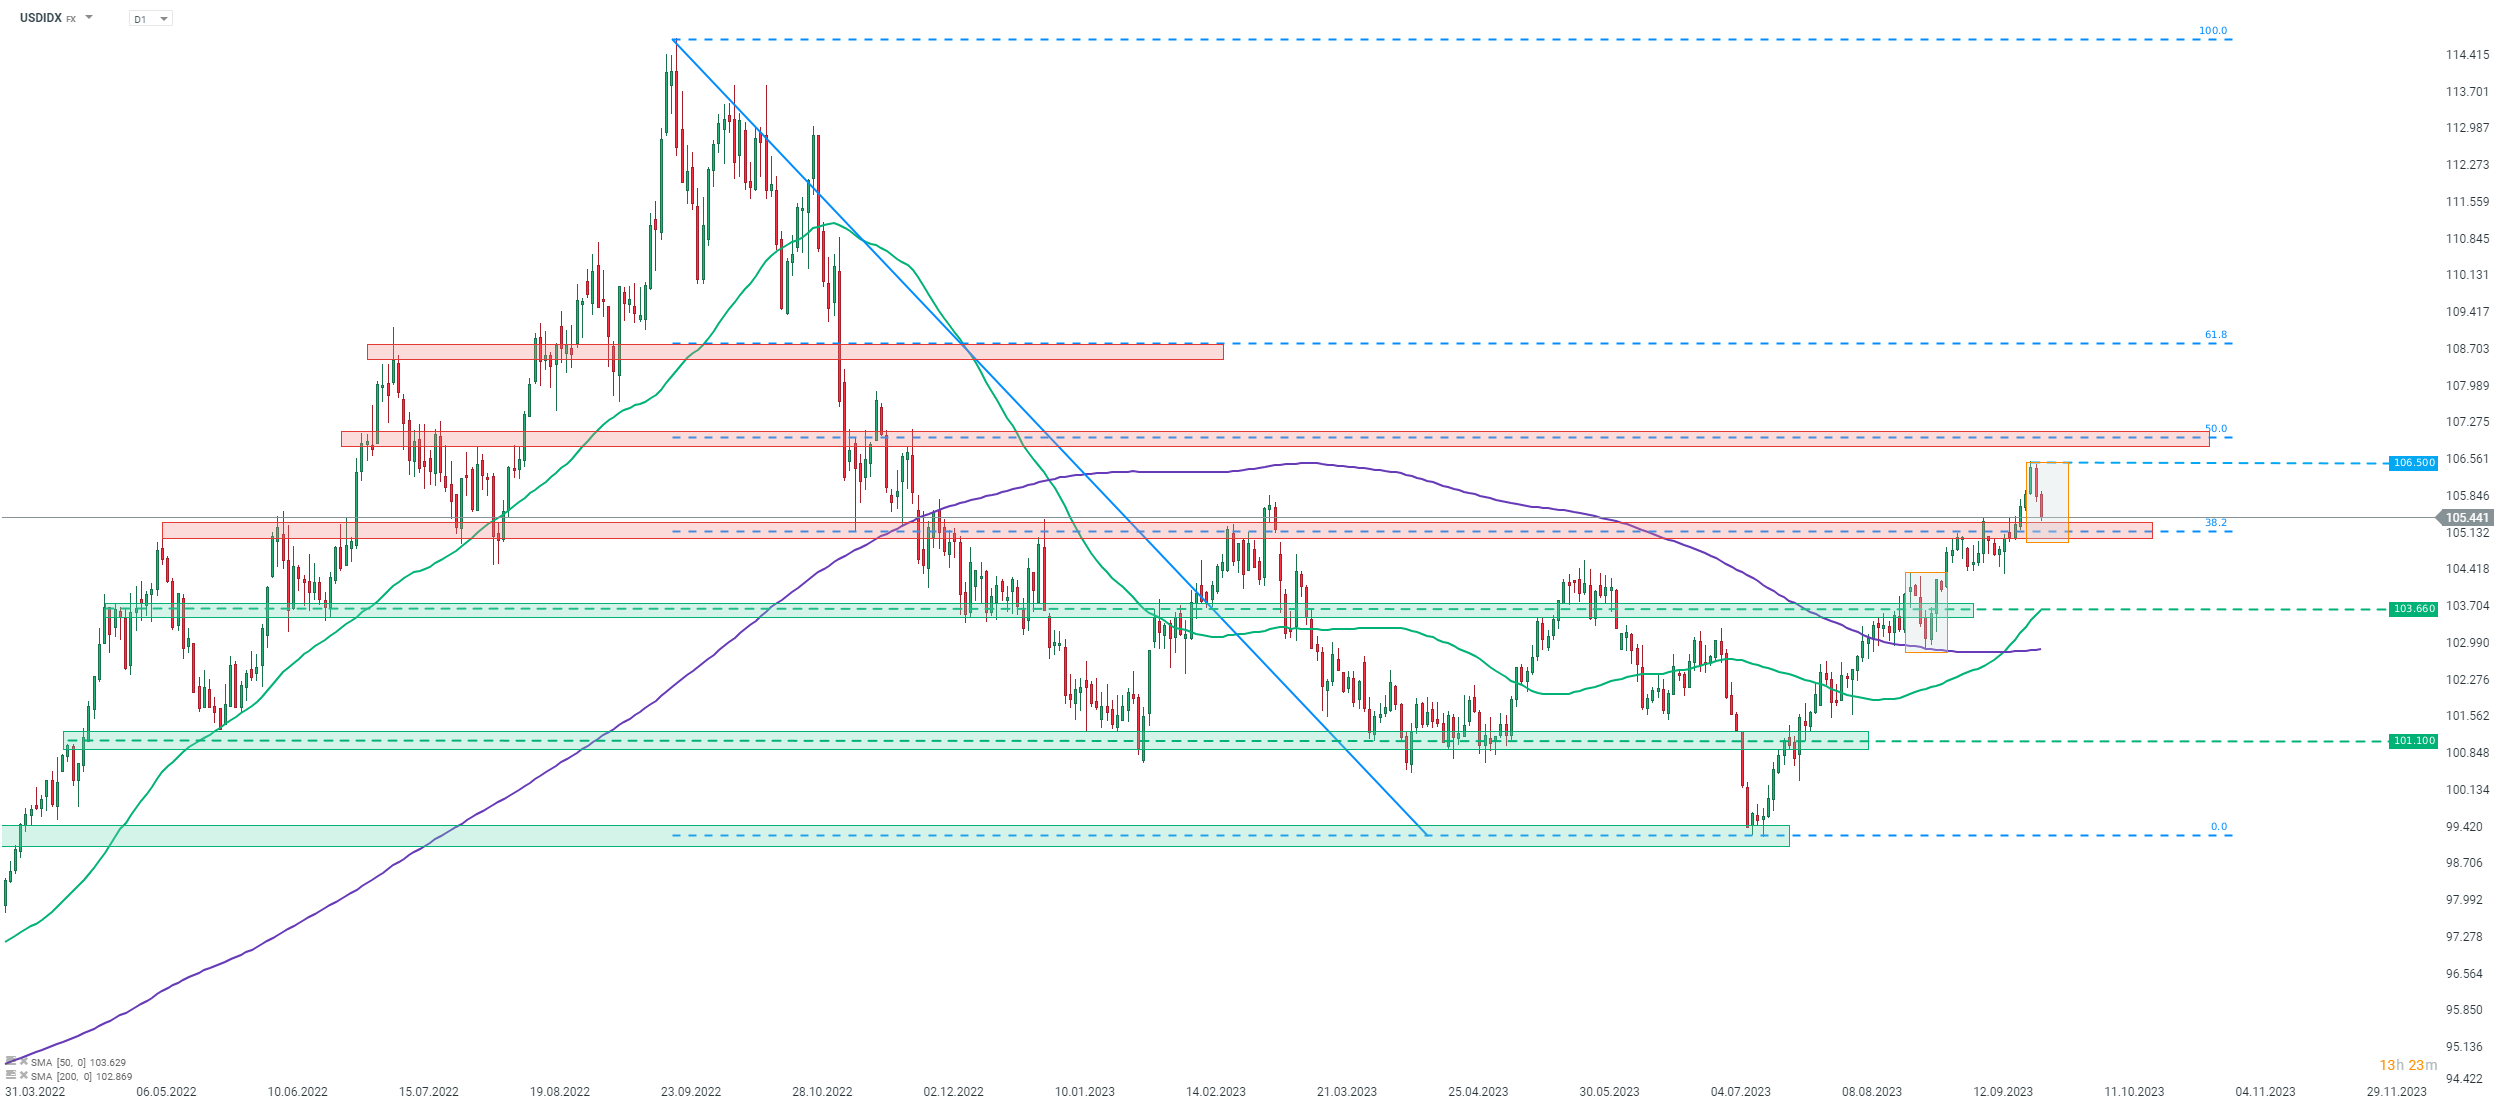 Source: xStation5

🔴ก๊าซยุโรปร่วง 7.5%

ข่าวเด่นวันนี้ 27 ก.ค.

3 ตลาดที่น่าจับตาในสัปดาห์นี้

BREAKING: เศรษฐกิจยูโรโซนฟื้นตัว? PMI สดใส แต่ราคาน้ำมันและก๊าซสูงยังเป็นแรงกดดัน