



The gold prices continue their drop from the end of last week. Technically looking at the D1 interval, a negative signal emerged on December 4th from the Overbalance methodology. After previous strong gains, there was an equally strong pullback, negating the broad 1:1 setup. Today, the quotations broke below the lower boundary of the upward channel, potentially paving the way for further price decreases. Currently, the price is approaching another short-term support at $1978, which is derived from measuring 50% of the last upward wave. If it breaks below this level, the decline could deepen even to $1939, where the next Fibonacci retracement of 61.8% is located, along with earlier price reactions.
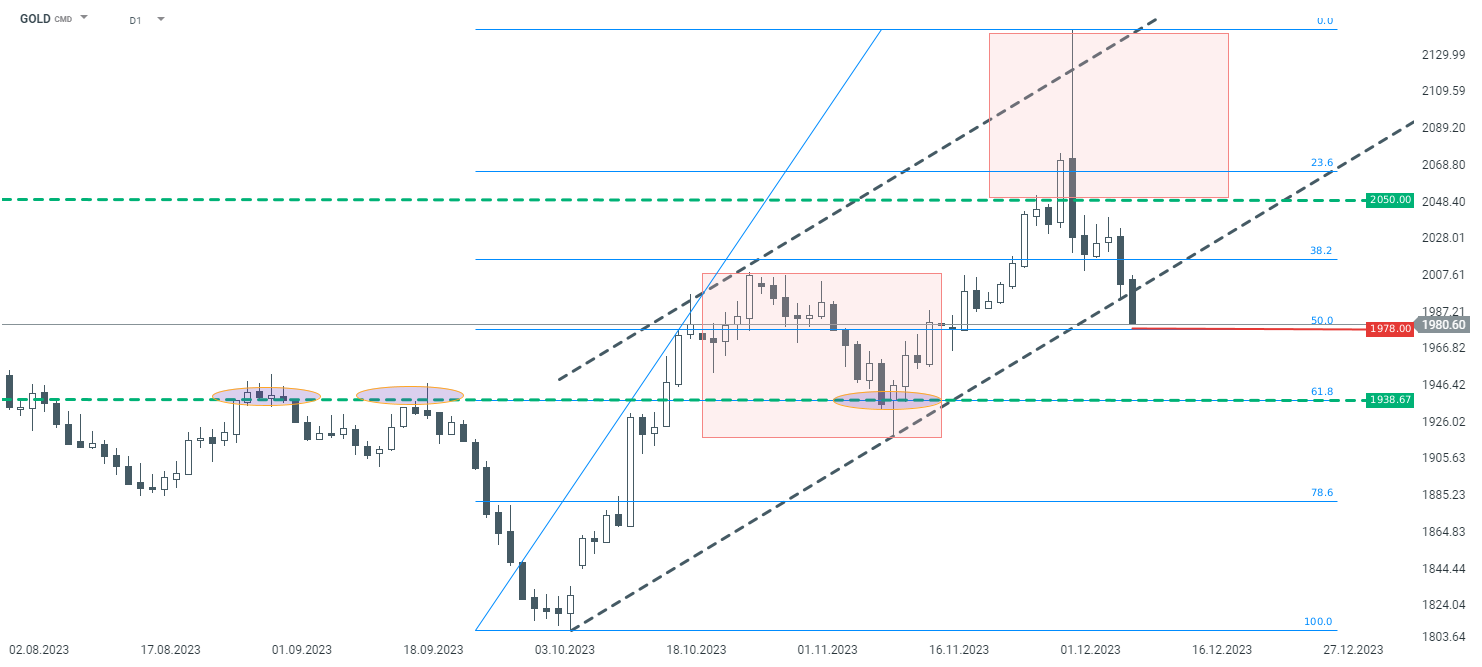
GOLD D1. Source: xStation5
Looking at a lower time interval - H1, a bearish sentiment prevails. In the short term, the key resistance area to watch is around $2010.5, which is indicated by earlier price reactions and a local 1:1 setup, as well as the EMA 100 average. It seems that as long as the price remains below this level, the basic scenario is a deepening of the declines. Only if the price moves above the $2010.5 zone might the sentiment shift to bullish.
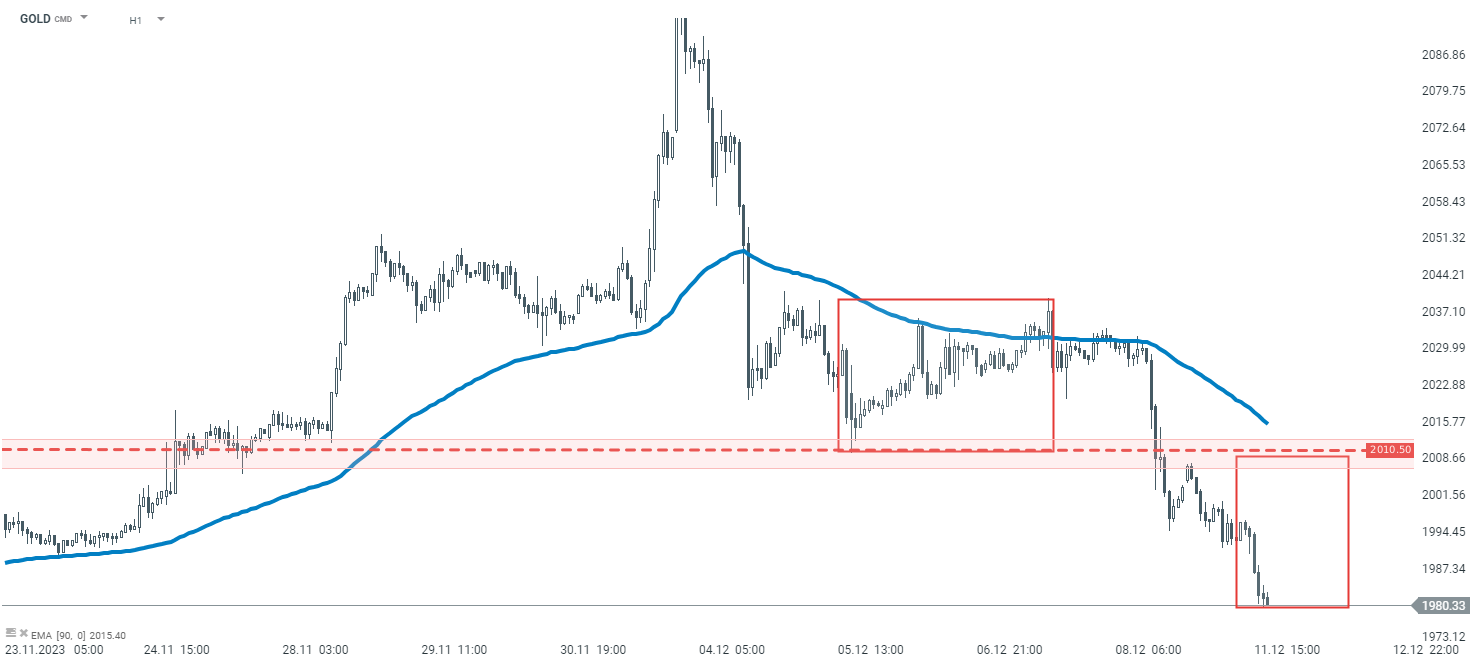
GOLD H1. Source: xStation5




ราคาทองคำร่วงลงกว่า 100 USD/oz แรงขายได้สิ้นสุดลงแล้วจริงหรือไม่?



ความกังวลต่อความสามารถในการทำกำไรของ AI จุดชนวนแรงเทขายในตลาด 📉
ทองคำร่วงหลุด 4,000 USD



ข่าวเด่นวันนี้ 23 ต.ค. มูลค่าหุ้นเผชิญแรงกดดัน เงินทุนไหลออกจากกลุ่มเทคโนโลยี