
In the last month of this year, increases in global markets are driven by speculation about upcoming cuts in interest rates and decreasing inflation. Particularly important here are data from the USA, which drive the rest of the markets and to some extent dictate the policy of other central banks. The last meeting of the Fed was received by the markets exceptionally dovishly and was a catalyst for increases. Indices are quoted around or above historical highs, all in the hope of the first Fed cuts as early as March, and certainly before the middle of next year. New projections indicated a total of 75 basis points of cuts in 2024. However, for the Fed's narrative to be maintained, inflation in the USA must continue its current downward trend. Let's look at a few charts to learn more about the possible direction in the coming months.
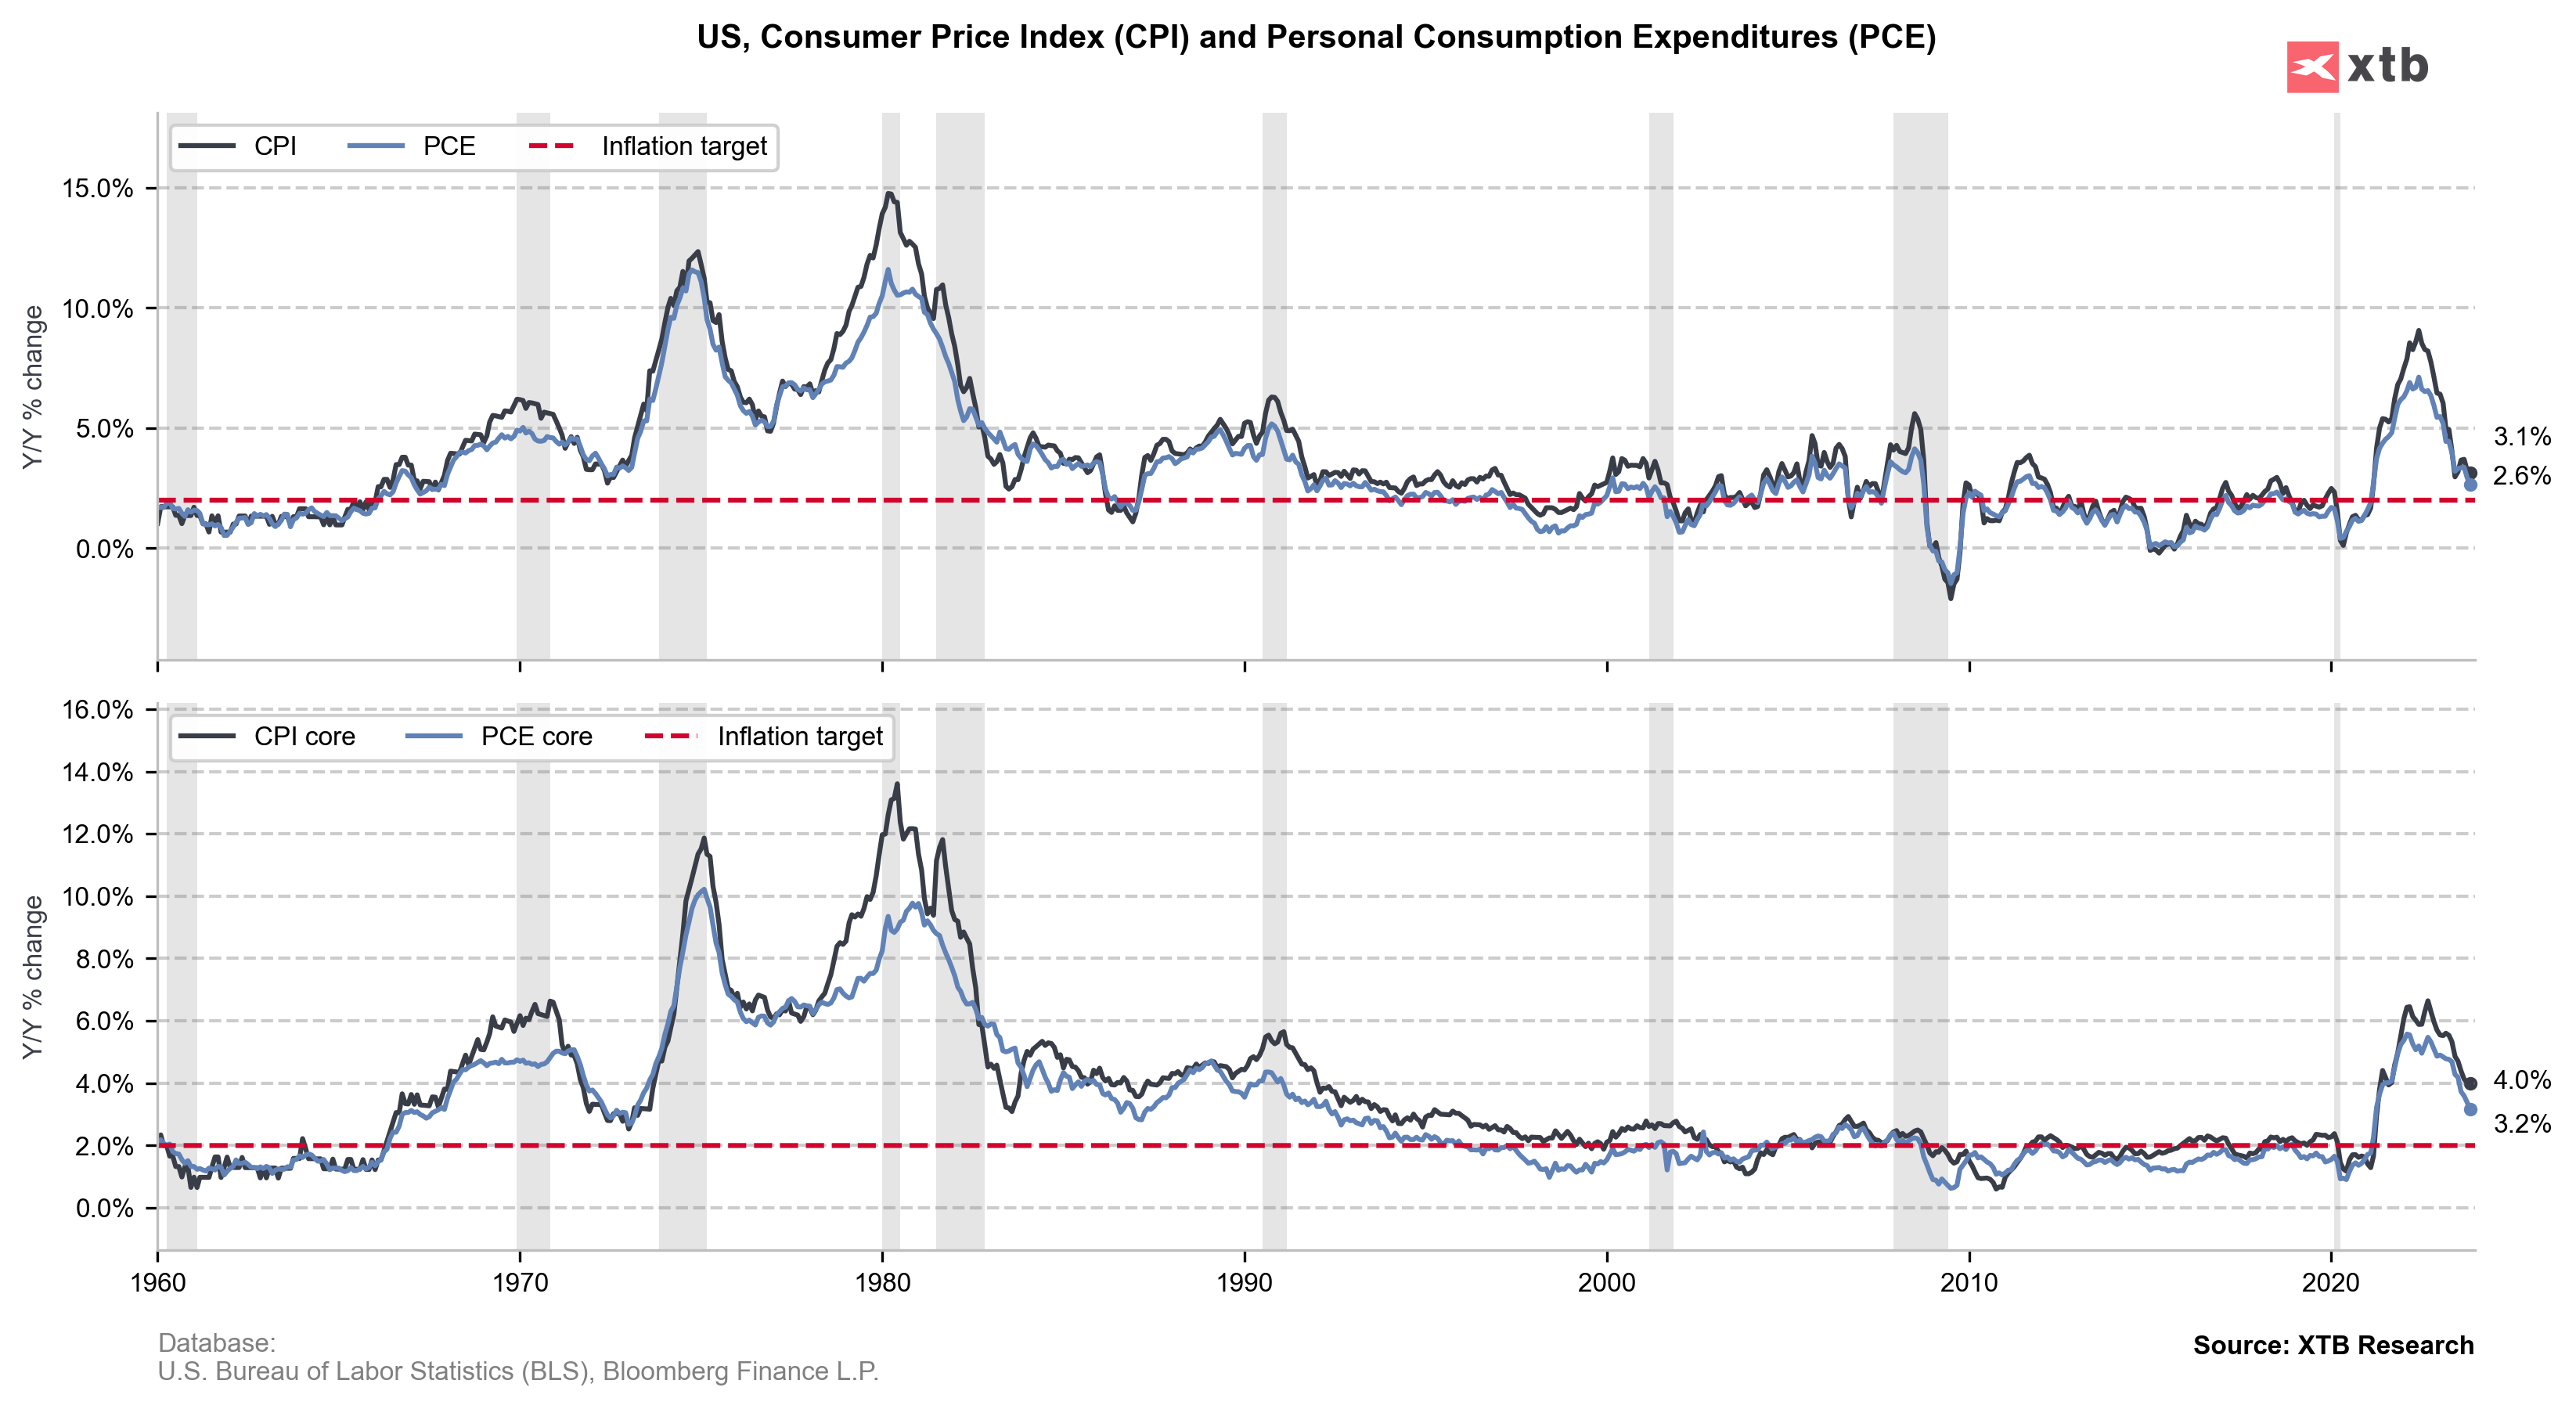
Today's PCE inflation report from the USA confirmed the continuing downward trend. Overall prices last month rose by just 2.6% year-over-year, which is simultaneously very close to the historical average of the last decade. It's important to remember that the Personal Consumption Expenditures (PCE) index is a preferred measure of inflation by the Fed, therefore its decline, higher than expected, should support the scenario of policy easing.

Although the labor market has begun to stabilize a bit, wages remain high. However, the data are no longer as high as at the turn of 2021-2022. Inflation is falling, and so far, the progress is really noticeable. However, a decrease in wage growth from 4.0% to around 2.0% historically may already be much more difficult to achieve in such a short term.
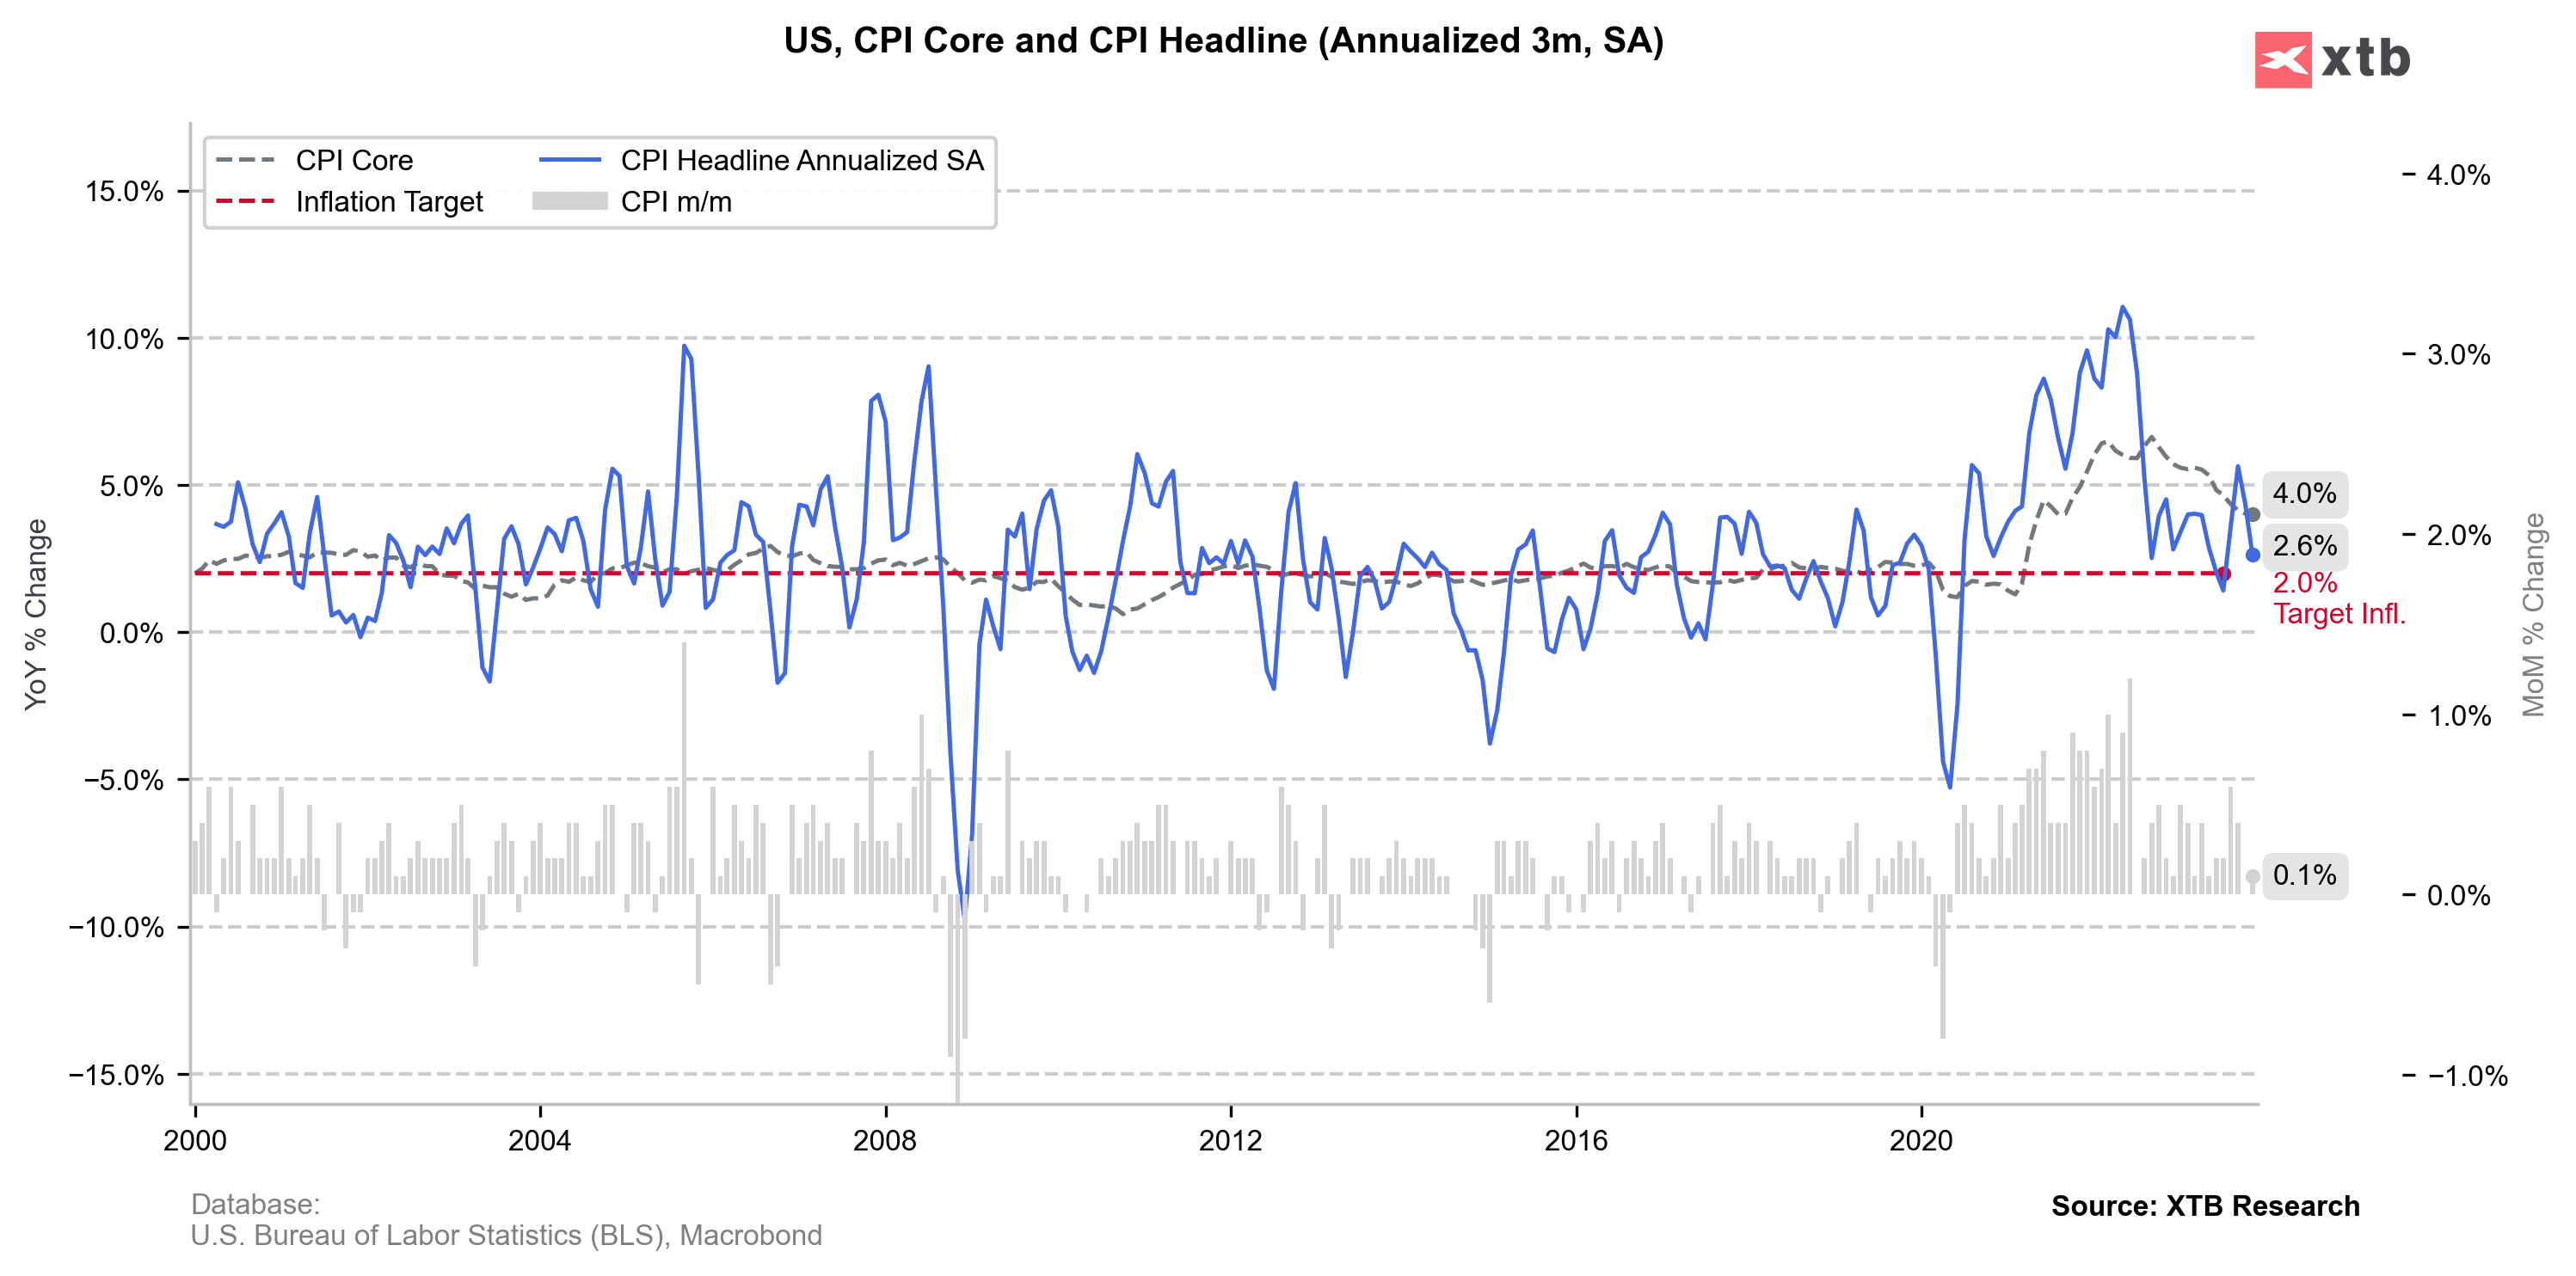
Annualized inflation based on price changes over the last 3 months also indicates a potentially good direction. Monthly changes show satisfying dynamics. Although there are still higher readings caused by the base effect and other factors, the direction is clear.
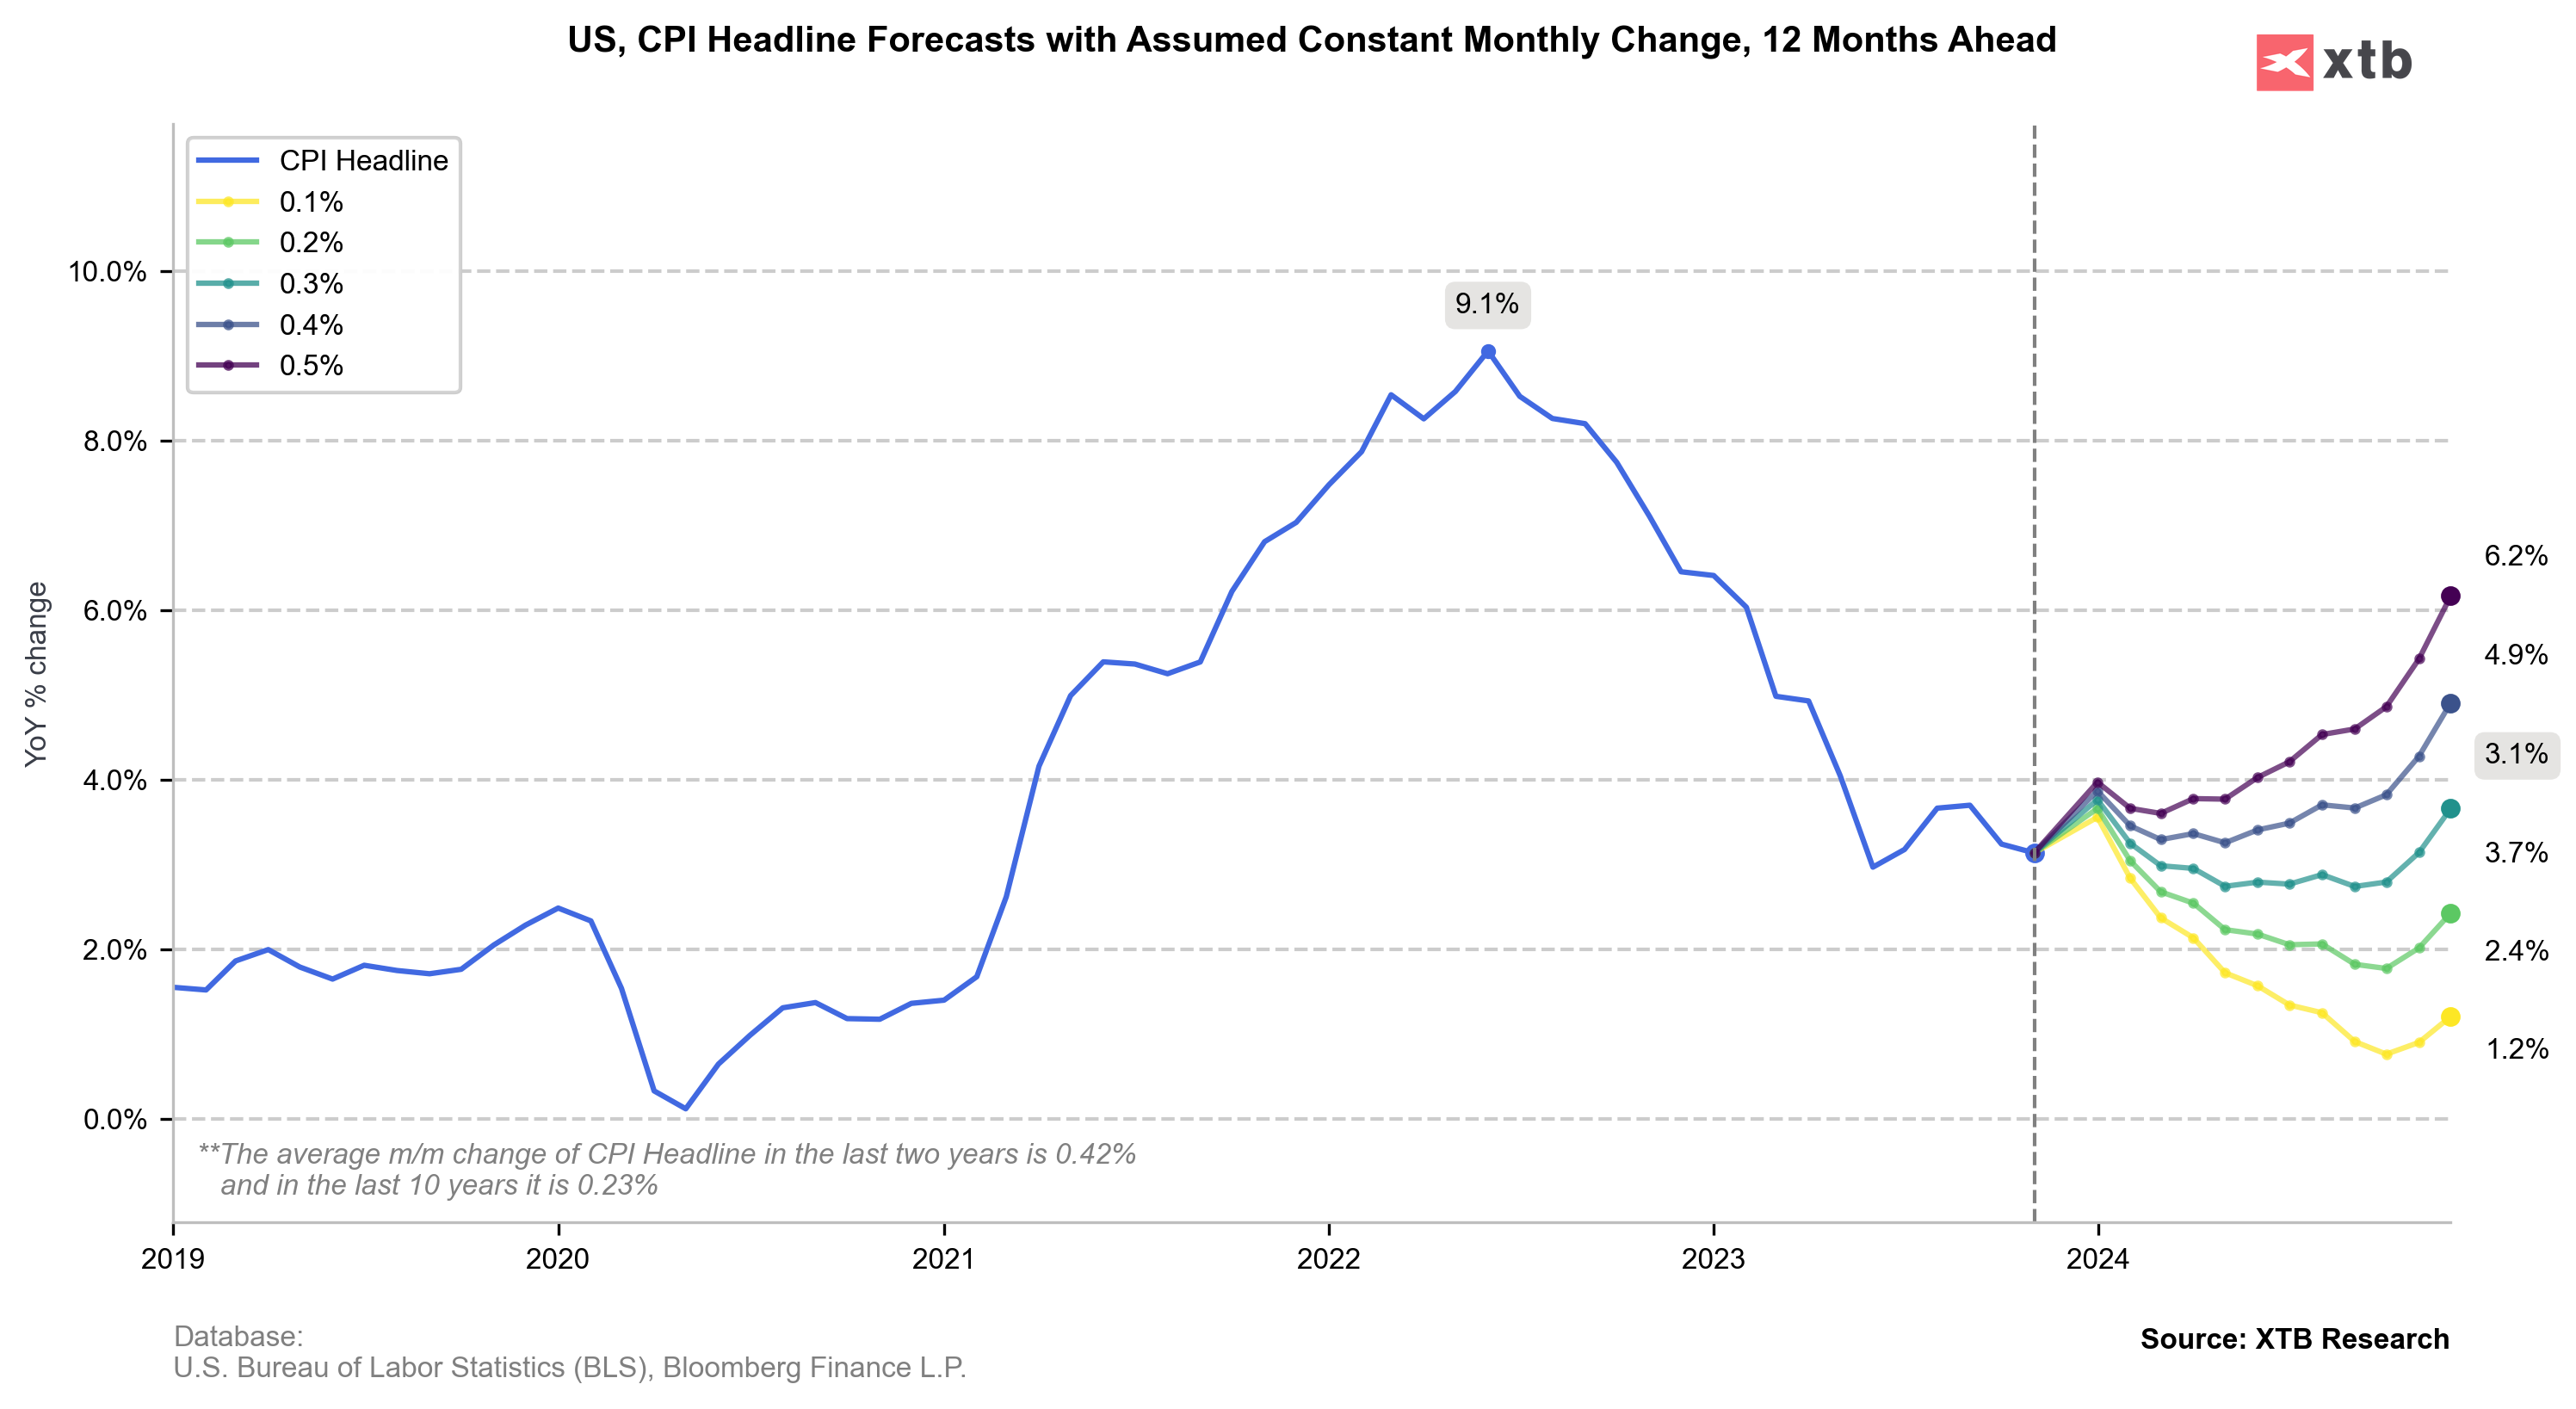
The above chart allows us to analyze how annual inflation readings would shape up, assuming constant month-over-month changes. Here, assuming a historical average of about 0.23% (green path), inflation in 2024 would maintain a downward trend. The exception might be the beginning of this year when, due to the base effect, we might see slightly higher readings.
The data show that the US economy is currently heading in the right direction and should gradually ease off. However, it's important to remember that we still remain in an environment of high-interest rates, and their impact on the economy may be visible in 2024.

Morning Wrap: ตลาดหุ้นลุ้นรีบาวด์ ท่ามกลางความขัดแย้งสหรัฐฯ-อิหร่าน

ข่าวเด่นวันนี้ 21 ก.ค.

ปฏิทินเศรษฐกิจวันนี้: เงินเฟ้อยุโรปและภาคอสังหาฯ สหรัฐฯ เป็นไฮไลต์

Economic Calendar: จับตาผลประกอบการ ยอดค้าปลีกสหรัฐฯ และถ้อยแถลง Fed ชิงความสนใจนักลงทุน