Mixed Q3 BlackRock results 📊 Net inflows lower 85% y/y

18:18 13 āļ•āļļāļĨāļēāļ„āļĄ 2023

Although BlackRock's (BLK.US) third-quarter results came in stronger than expected (especially on a net basis), the world's largest asset manager reported the first outflow from long-term funds since the onset of the coronavirus pandemic. Its clients withdrew a total of $13 billion, signaling weaker sentiment toward the stock market (and its long-term growth) in an environment of rising yields and money market funds. BlackRock's shares were also uder pressure last year due to rising interest rates and mixed sentiment in the stock market. Importantly, the fund definitely improved margins and earnings per share beat expectations - it also turned out to be more than 30% higher y/y. Currently, pre-opening quotes indicate a flat market reaction - strong performance offset concerns about potential further outflows - since Q3 equity market sentiment has deteriorated somewhat (with rising 10-yr treasuries yields).

  • Revenues: $4.52 billion vs. $4.51 billion exp. (up 4.9% y/y)
  • Earnings per share (EPS): $10.91 vs. $8.20 exp. ($9.55 in Q3 2022)
  • Assets under management (AUM):  $9.1 trillion vs. $9.23 trillion exp. (14% increase y/y)
  • Net capital inflows: $2.57 billion vs. $61.74 billion exp. (down 85% y/y)
  • Operating margin :36.2% vs. 35.8% exp. and 35.4% in Q3 2022
  • Costs: $2.8 billion (in line with expectations (up 3.6% y/y) 
  • Equity market fund inflows: $34.47 billion in outflows vs. $11.46 billion inflows exp.
  • Long-term funds inflows: $12.64 billion in outflows vs. $50 billion inflows exp.
  • Inflows to fixed income funds: $13.21 billion vs. $23.33 billion exp.
  • Technology services revenue: $407 million vs. $365 million exp. (20% y/y increase)

Higher yields a threat to BlackRock's core business?

In a commentary on the results, CEO Larry Fink pointed out that investors now have 'real' opportunities to earn satisfactory returns outside of the stock market and risk assets. We see this influencing the behavior of BlakcRock's clients, who can now 'wait out' potentially tougher times outside the equity market by using money market funds before monetary policy normalizes, once again creating a climate conducive to 'risk appetite' - which has helped the fund for the past 20+ years. At the same time, we see that BlackRock's performance with 'fixed income' - has not mitigated the weakness seen with equity market funds and has severely disappointed market expectations. Clients are moving funds not only within the assets managed by the fund but also outside of it, which may negatively affect the 'shrinking' business. On the other hand, the company strongly improved net income, with a slight increase in expenses y/y. 

āđ€āļĢāļīāđˆāļĄāđ€āļ—āļĢāļ”āļ—āļąāļ™āļ—āļĩāļ§āļąāļ™āļ™āļĩāđ‰ āļŦāļĢāļ·āļ­ āļĨāļ­āļ‡āđƒāļŠāđ‰āļšāļąāļāļŠāļĩāļ—āļ”āļĨāļ­āļ‡āđāļšāļšāđ„āļĢāđ‰āļ„āļ§āļēāļĄāđ€āļŠāļĩāđˆāļĒāļ‡

āđ€āļ›āļīāļ”āļšāļąāļāļŠāļĩ āļĨāļ­āļ‡āļšāļąāļāļŠāļĩāđ€āļ”āđ‚āļĄāđˆ āļ”āļēāļ§āļ™āđŒāđ‚āļŦāļĨāļ”āđāļ­āļ›āļĄāļ·āļ­āļ–āļ·āļ­ āļ”āļēāļ§āļ™āđŒāđ‚āļŦāļĨāļ”āđāļ­āļ›āļĄāļ·āļ­āļ–āļ·āļ­

BlackRock (BLK.US, D1) chart.

Looking at the chart, we can see that the price has failed to hold above the 38.2 Fibonacci retracement of the March 2020 upward wave, and now a possible scenario is a test of 61.8 at $570 and 71.6 where we see the level from last autumn's oversold lows at $500 per share. At the same time we can see forming a bullish crossover of the averages on the MACD, which could potentially signal an upcoming 'non-intuitive' upward market reaction.
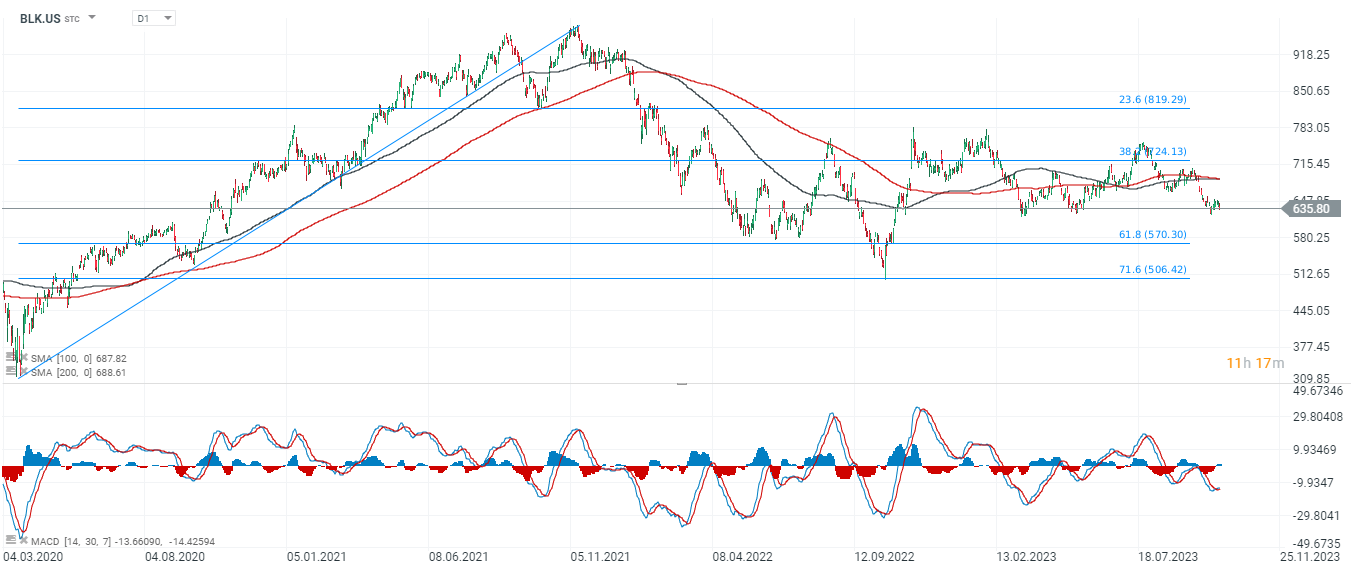

Source: xStation5

āļŦāļļāđ‰āļ™:
āļāļĨāļąāļšāđ„āļ›

āļ‚āđˆāļēāļ§āđƒāļ™āļ•āļĨāļēāļ”āļāļēāļĢāđ€āļ‡āļīāļ™

01.10.2025
16:34

āļ•āļĨāļēāļ”āđ€āļ”āđˆāļ™āļ§āļąāļ™āļ™āļĩāđ‰: USDJPY

āđ€āļĒāļ™āđ€āļ›āđ‡āļ™āļŠāļāļļāļĨāđ€āļ‡āļīāļ™ G10 āļ—āļĩāđˆāđāļ‚āđ‡āļ‡āļ„āđˆāļēāļ•āļīāļ”āļ•āđˆāļ­āļāļąāļ™āđ€āļ›āđ‡āļ™āļ§āļąāļ™āļ—āļĩāđˆāļŠāļēāļĄ āđ€āļžāļīāđˆāļĄāļ‚āļķāđ‰āļ™ 0.5% āđ€āļ—āļĩāļĒāļšāļāļąāļšāļ”āļ­āļĨāļĨāļēāļĢāđŒāļŠāļŦāļĢāļąāļ āđāļĨāļ° 0.35% āđ€āļ—āļĩāļĒāļšāļāļąāļšāļĒāļđāđ‚āļĢ āļŠāļāļļāļĨāđ€āļ‡āļīāļ™āļāļĩāđˆāļ›āļļāđˆāļ™āđ„āļ”āđ‰āļĢāļąāļšāļāļēāļĢāļŠāļ™āļąāļšāļŠāļ™āļļāļ™āļ—āļąāđ‰āļ‡āļˆāļēāļāļŠāļąāļāļāļēāļ“āđ€āļŠāļīāļ‡āđāļ‚āđ‡āļ‡āļāļĢāđ‰āļēāļ§āļ‚āļ­āļ‡...

16:30

āļ‚āđˆāļēāļ§āđ€āļ”āđˆāļ™: EURUSD āļ—āļĢāļ‡āļ•āļąāļ§āļŦāļĨāļąāļ‡āđ€āļ‡āļīāļ™āđ€āļŸāđ‰āļ­āļĒāļđāđ‚āļĢāđ‚āļ‹āļ™āļ­āļ­āļāļĄāļēāļ•āļĢāļ‡āļ•āļēāļĄāļ„āļēāļ”āļāļēāļĢāļ“āđŒ 🇊🇚

10:00 āļ™. BST, āļĒāļđāđ‚āļĢāđ‚āļ‹āļ™ – āļ‚āđ‰āļ­āļĄāļđāļĨāđ€āļ‡āļīāļ™āđ€āļŸāđ‰āļ­āđ€āļ”āļ·āļ­āļ™āļāļąāļ™āļĒāļēāļĒāļ™ CPI: āļŠāļđāļ‡āļ‚āļķāđ‰āļ™ 2.2% YoY; āļ„āļēāļ”āļāļēāļĢāļ“āđŒ 2.2% YoY; āļāđˆāļ­āļ™āļŦāļ™āđ‰āļē 2.0% YoY Core CPI: āļŠāļđāļ‡āļ‚āļķāđ‰āļ™...

15:04

āļ‚āđˆāļēāļ§āđ€āļ”āđˆāļ™: āļ”āļąāļŠāļ™āļĩ PMI āļ āļēāļ„āļāļēāļĢāļœāļĨāļīāļ•āļ‚āļ­āļ‡āļāļĢāļąāđˆāļ‡āđ€āļĻāļŠāđāļĨāļ°āđ€āļĒāļ­āļĢāļĄāļ™āļĩāļĢāđˆāļ§āļ‡āđ€āļ‚āđ‰āļēāļŠāļđāđˆāļ āļēāļ§āļ°āļŦāļ”āļ•āļąāļ§ ðŸ‡Ŧ🇷ðŸ‡Đ🇊

āļ­āļąāļ›āđ€āļ”āļ•āļ‚āđ‰āļ­āļĄāļđāļĨ PMI āļ āļēāļ„āļāļēāļĢāļœāļĨāļīāļ• ðŸ‡Đ🇊 āđ€āļĒāļ­āļĢāļĄāļ™āļĩ (āļāļąāļ™āļĒāļēāļĒāļ™) HCOB Manufacturing PMI: 49.5 (āļ„āļēāļ”āļāļēāļĢāļ“āđŒ 48.5; āļāđˆāļ­āļ™āļŦāļ™āđ‰āļē 49.8) ðŸ‡Ŧ🇷 āļāļĢāļąāđˆāļ‡āđ€āļĻāļŠ (āļāļąāļ™āļĒāļēāļĒāļ™) HCOB...

āđ€āļ‚āđ‰āļēāļŠāļđāđˆāļ•āļĨāļēāļ”āļžāļĢāđ‰āļ­āļĄāļĨāļđāļāļ„āđ‰āļēāļ‚āļ­āļ‡ XTB Group āļāļ§āđˆāļē 1 700 000 āļĢāļēāļĒ

āļœāļĨāļīāļ•āļ āļąāļ“āļ‘āđŒāļ—āļēāļ‡āļāļēāļĢāđ€āļ‡āļīāļ™āļ—āļĩāđˆāđ€āļĢāļēāđƒāļŦāđ‰āļšāļĢāļīāļāļēāļĢāļĄāļĩāļ„āļ§āļēāļĄāđ€āļŠāļĩāđˆāļĒāļ‡ āđ€āļĻāļĐāļŦāļļāđ‰āļ™ (Fractional Shares) āđ€āļ›āđ‡āļ™āļœāļĨāļīāļ•āļ āļąāļ“āļ‘āđŒāļ—āļĩāđˆāđƒāļŦāđ‰āļšāļĢāļīāļāļēāļĢāļˆāļēāļ XTB āđāļŠāļ”āļ‡āļ–āļķāļ‡āļāļēāļĢāđ€āļ›āđ‡āļ™āđ€āļˆāđ‰āļēāļ‚āļ­āļ‡āļŦāļļāđ‰āļ™āļšāļēāļ‡āļŠāđˆāļ§āļ™āļŦāļĢāļ·āļ­ ETF āđ€āļĻāļĐāļŦāļļāđ‰āļ™āđ„āļĄāđˆāđƒāļŠāđˆāļœāļĨāļīāļ•āļ āļąāļ“āļ‘āđŒāļ—āļēāļ‡āļāļēāļĢāđ€āļ‡āļīāļ™āļ­āļīāļŠāļĢāļ° āļŠāļīāļ—āļ˜āļīāļ‚āļ­āļ‡āļœāļđāđ‰āļ–āļ·āļ­āļŦāļļāđ‰āļ™āļ­āļēāļˆāļ–āļđāļāļˆāļģāļāļąāļ”
āļ„āļ§āļēāļĄāļŠāļđāļāđ€āļŠāļĩāļĒāļŠāļēāļĄāļēāļĢāļ–āđ€āļāļīāļ™āļāļ§āđˆāļēāđ€āļ‡āļīāļ™āļ—āļĩāđˆāļāļēāļ