
US natural gas prices (NATGAS) resumed a climb after a brief pause yesterday. New 6-10 day weather forecasts for the United States show that the biggest deviations below average temperatures are expected in key heating regions in the near-term. However, it should be noted that temperatures in the US South West are expected to be near- or above-average in the coming days. As subsequent forecast hint at a cold snap moving eastwards, it cannot be ruled out that a period of warmer weather will start once the current cold wave passes. It was also reported that recent pick-up in hostilities in the Middle East, especially in the Red Sea, is having an impact on natural gas supplies as well, with LNG cargoes being diverted around Africa. According to Bloomberg data, number of LNG cargoes going via Cape of Good Hope has climbed to 9 in the week of January 1-7, 2024 - the highest number since October 2021.
Meanwhile, European natural gas benchmarks continue to pull back today as weather forecasts for the Old Continent turn milder. European gas prices trade under pressure as inventories in Europe remain ample and even a recent period of colder weather did not accelerate withdrawals.
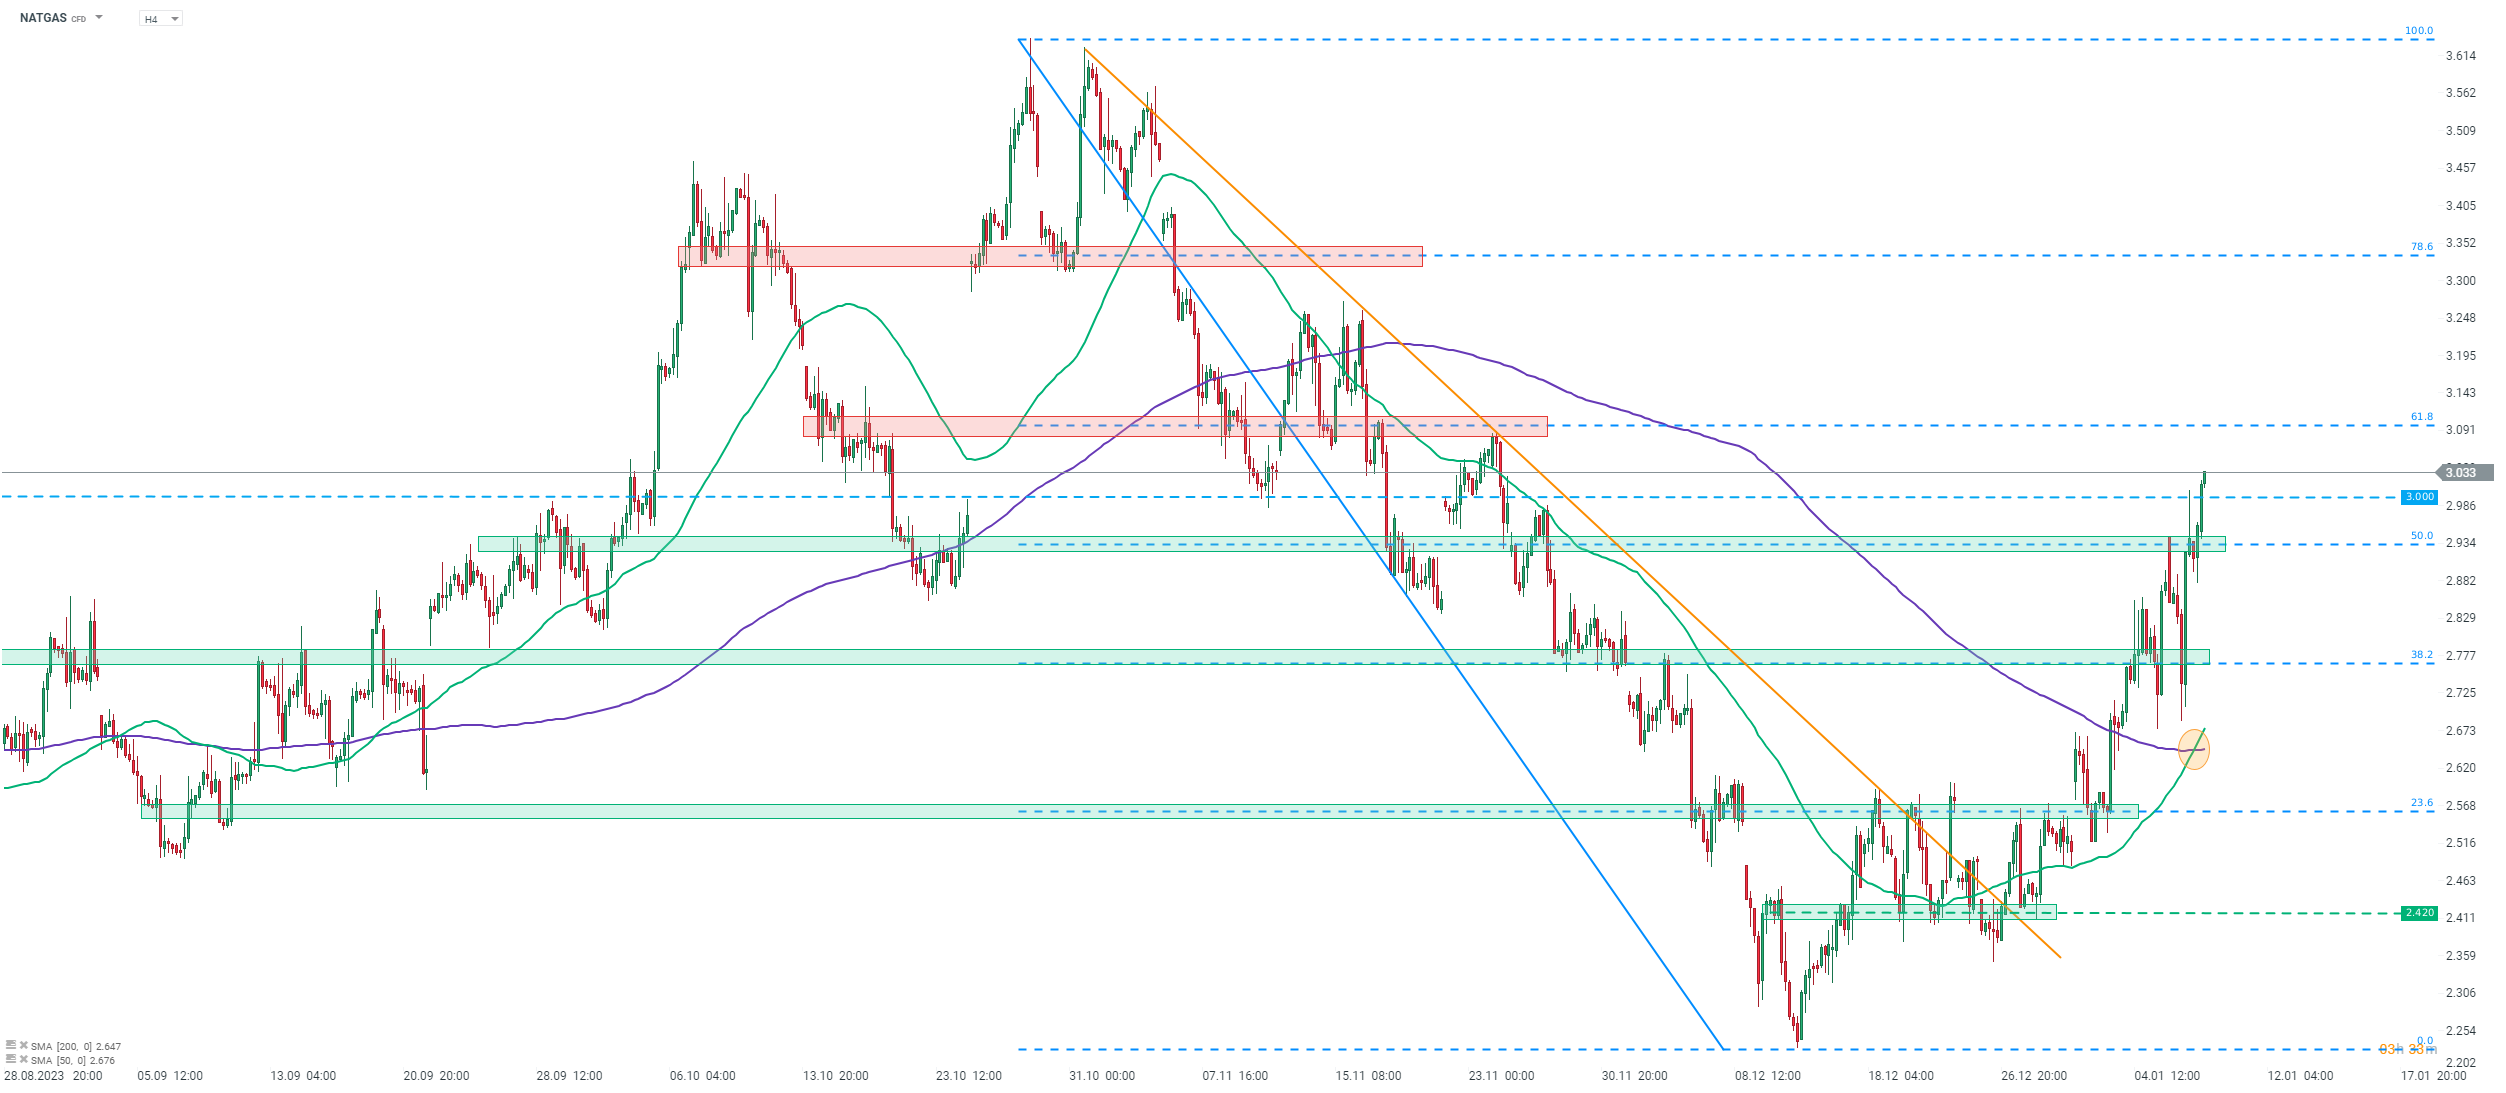
Taking a look at NATGAS chart at H4 interval, we can see that price has already jumped around 35% off a local low reached less than a month ago (December 13, 2023). The move has been very quick and has clearly accelerated following a break above the 200-period moving average (purple line). US weather forecasts getting colder provided fuel for the rally, with NATGAS jumping above the psychological $3.00 per MMBTu mark today. Bulls also managed to break above this level yesterday, but the breakout was brief and price quickly pulled back. The next resistance level to watch can be found ranging around the 61.8% retracement of the downward move launched at the turn of October and November 2023 ($3.10 area). A point to note is that 50-period moving average has recently broken above 200-period moving average (orange circle), painting a bullish pattern known as 'golden cross'.
 Source: xStation5

Chart of the Day 🚩 OIL ย่อตัวทดสอบแนวรับ 92.5 ดอลลาร์ต่อบาร์เรล

Morning Wrap: ตลาดจะฟื้นตัวหลังแรงเทขายเมื่อวันพฤหัสบดีหรือไม่❓

ข่าวเด่นวันนี้ 24 ก.ค.
ความตึงเครียดรอบอิหร่านกดดันตลาด!