



GBPJPY traded in a downward move since late-May 2021. However, the downward move was stopped at the 149.75 support zone at the end of the previous week. This was the second time this zone halted decline and ongoing strong rebound suggested that a move towards the downward trendline may be looming. The near-term resistance to watch can be found at 151.20 and is marked with previous price reactions. Breaking above would pave the way towards the aforementioned trendline that currently runs in the 152.70 area. Note that in order to invalidate the downtrend structure a break above the local highs at 153.10 would be required.
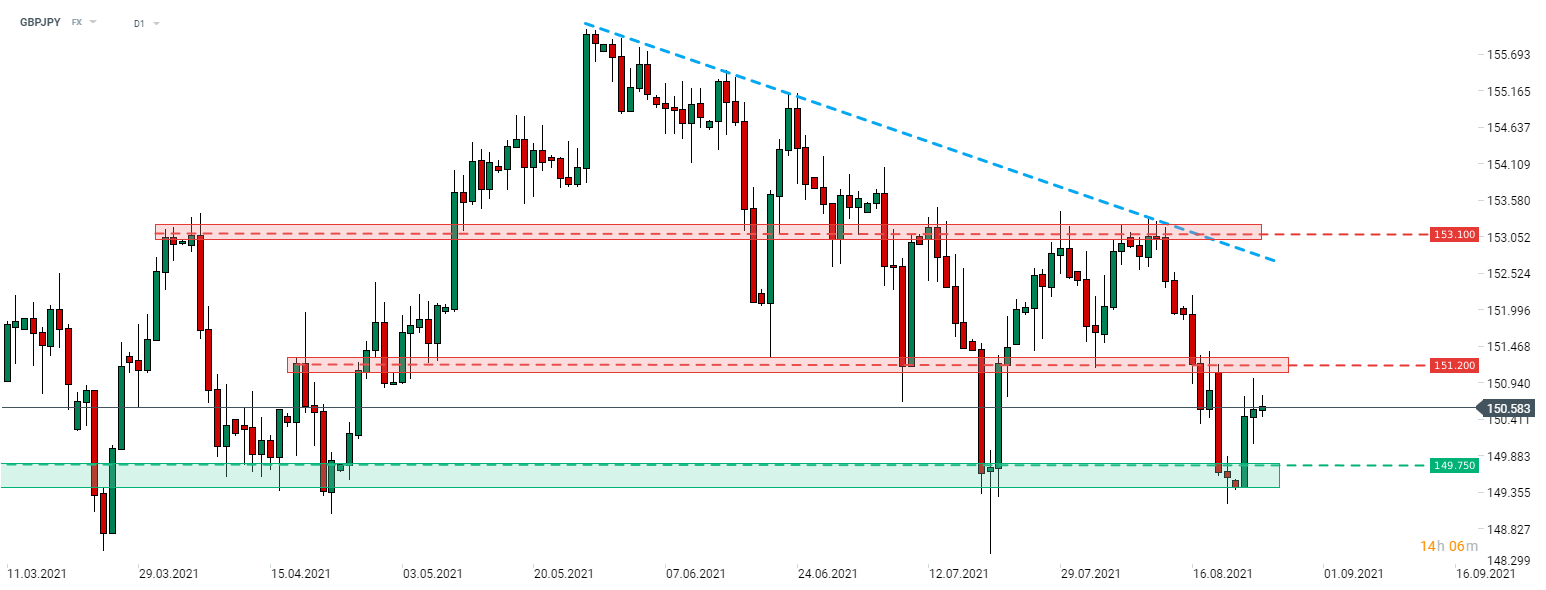 Source: xStation5


🔼 EURUSD ฟื้นตัวต่อเนื่อง

Economic Calendar: จับตาเงินเฟ้อยูโรโซนขั้นสุดท้าย ดัชนีภาคการผลิตสหรัฐฯ และผลประกอบการธนาคารระดับภูมิภาค


Warsh ยังไม่ส่งสัญญาณเรื่องดอกเบี้ย ความกังวลหนี้ AI กดดันตลาด แต่เริ่มเห็นสัญญาณฟื้นตัว 📈

เงินเฟ้อสหรัฐฯ ร้อนแรง 🔥📈 PPI และยอดค้าปลีกพุ่งขึ้น!